 Fact Sheet #39
  Fact Sheet #39
November 23, 1998
Purdue University
High Value Soybean Composition
Dirk E. Maier, Jason Reising, & Jenni L. Briggs, Agricultural & Biological Engineering
Kelly M. Day & Ellsworth P. Christmas, Agronomy
Soybean performance trials have been conducted by the Purdue University Agronomy Department at several locations in Indiana for many years. In the past the primary focus has been on the agronomic performance of varieties (see bulletin B759). Since 1996 samples have also been collected from the test plots for compositional analysis (protein, oil, fiber). This fact sheet summarizes the first and second years of compositional data and end-use values for these soybean samples.
Value-Adding Traits
Value-added grains and oilseeds (or Specialty Grains, High Value Crops) have specific traits that have been genetically developed for specific end-use purposes, such as for corn dry and wet milling, snack food manufacturing, soybean oil refining, and peroxidase recovery from soybean hulls. Examples include food grade white and yellow corn, waxy corn, high oil corn, low linoleic soybeans, and high peroxidase soybeans. High value end-use products include starch, sweeteners, oil, snack foods, gluten feed, tofu, and high protein animal feeds.
Farmers may already have an opportunity to capture value-adding returns from certain commercially available corn and soybean varieties. However, these varietal differences need to be documented to yield consistently better in the field and the processing plant. Based on recent research by Iowa State University, the capability already exists for soybean crushers in any region of the Midwest to raise their processed output values by an average of 12 cents per bushel of soybeans. The maximum estimated potential gain is 25 cents per bushel. The reason for this potential lies in the genetic material and agronomic practices already in use by some producers, even though these producers may not be directly aware of the potential of their actions.
Compositional analysis (oil, protein, and fiber content) of soybean end-use traits at the first point of sale is a growing trend that will soon become a common grain industry practice. Technology is available today that can measure oil, protein, and fiber contents quickly (in less than one minute) and accurately. However, the technology is still relatively expensive and thus slow to reach country elevators.
In the future, a new form of traits-based marketing will replace the traditional grade-based grain marketing. In order for farmers to benefit from marketing their products based on value-adding end-use characteristics, they need to know what seed varieties and site-specific farming practices lead to the highest agronomic and processing yields. Current research at Purdue University will help Indiana farmers determine what soybean varieties should be selected and agronomic practices implemented to maximize agronomic and processing yields.
Soybean Crushing
The primary goal of a soybean crusher is to maximize the pounds of oil and meal processed from every bushel of soybeans. An average soybean bushel of 60 lb contains 35% protein, 18.5% oil, and 5% fiber, and yields 11 lb of oil and 48 lb of 44% protein meal. The crush margin, which is the difference between the value of soybean meal plus oil and the purchase price of raw soybeans, is generally based on this average end-product yield.
Unfortunately, not every bushel of soybeans will yield the same pounds of oil and meal. There is considerable variability in the protein and oil content of soybeans among countries, states, regions within states, and among varieties. The actual yield of crude oil and meal per bushel of raw soybeans is determined by the soybean protein and oil content, along with processing conditions and efficiencies. Higher soybean protein content allows the processor to include more hulls in the meal while still meeting protein specifications. This results in a greater meal yield and improves the crush margin. The National Oilseed Processors Association (NOPA) rules for soybean product trading set certain limits on the maximum allowable fiber content of the meal. The fiber limitation is 7.0% for 44% protein meal and 3.5% for 48% protein (dehulled) meal.
There are optimum ranges of soybean protein and oil content depending on the type of soybean meal (44 or 48%) being produced. Under market conditions that are meal-driven to slightly oil-driven, increased protein is more valuable than increased oil. The value of soybeans of higher than average levels of protein is limited by the lack of premiums for meal protein contents in excess of specifications. Currently, domestic soybean crushers do not pay explicit premiums for soybeans with a higher protein content.
Soybean crushers are, however, becoming more aware of the variability of soybean composition and how it affects end-product yield. The Federal Grain Inspection Service (FGIS) now includes soybean protein and oil analysis as optional criteria in U.S. Soybean Standards. As protein and oil become more accepted as marketing criteria, crushers, traders, producers, and plant breeders will need a basis for comparing individual lots of soybeans. Crushers and traders need to know the end-product value of what they are buying to determine what they can afford to pay. Producers must have the ability to evaluate varieties and cultural practices based on anticipated end-use value to the crusher. Soybean breeders need a meaningful criterion to use in long-term variety development programs.
End-Product Yield Potential of Indiana Soybeans
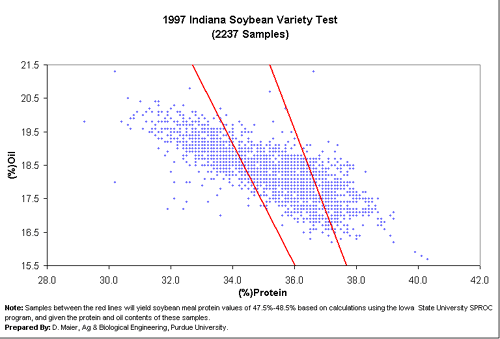
An area can be defined by means of two lines on a protein vs. oil plot. Soybean samples falling between these lines on the plot will yield meal protein values of 47.5-48.5%. From a crusher’s perspective, soybeans delivered to their plant that fall between those two lines would have the highest EPV per bushel. They would require little adjustment to the solvent extraction process in order to yield the desired end products within the required NOPA limitations. Soybeans that fall outside this area have to be "blended up or down" to achieve 44% or 48% protein meal, which decreases the crushing margin.
Figures 1 and 2 show the 1996 and 1997 data for the oil and protein content of each sample collected from the Indiana Soybean Performance Test. The 1996 data shows that relatively few samples were within the desired soybean meal protein range. In 1997, there was a marked shift into the acceptable soybean meal protein range for all samples. The changes in the end-use soybean characteristics may have been affected by conditions during the growing season, soil fertility, planting date, maturity group, and variety selection. As more data are collected, statistical inferences may be made to determine what factors affect the compositional values of Indiana soybeans.
Figure 1 - Oil versus protein content of all soybean variety samples from the 1996 Indiana Soybean Performance Test.
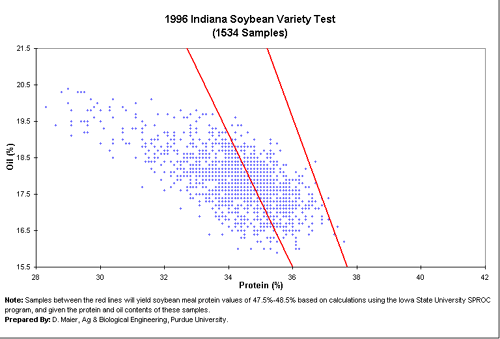
Figure 2 - Oil versus protein content of all soybean variety samples from the 1997 Indiana Soybean Performance Test.
Effect of Location on Composition
According to the data, the statewide averages for protein and oil at the five locations of the performance test were higher in 1997 than in 1996 (Table 1). Protein content increased by 1.4 percentage points, and oil increased by 0.4 percentage points from 1996. The average fiber content decreased by 0.2 points from the previous year. The average protein + oil value across all plots and maturities increased by 1.6 points. The spread or range in protein, fiber, and protein + oil sum decreased compared to 1996. Oil content spread increased by 0.5 points in 1997 to 4.2 points. Location 4 (SW Indiana) had the highest protein + oil averages in both years. Location 5 (SE Indiana) and Location 2 (WC Indiana) had the lowest protein + oil averages in 1996 and 1997, respectively.
Table 1 - Protein, oil, fiber and protein + oil values by location of all soybean varieties of the 1996 and 1997 Indiana Soybean Performance Tests.
|
Location* |
Maturity Group |
Protein (%) |
Oil (%) |
Fiber (%) |
Protein + Oil (%) |
||||
|
1996 |
1997 |
1996 |
1997 |
1996 |
1997 |
1996 |
1997 |
||
|
1 |
I & II |
34.3 |
37.0 |
17.7 |
17.4 |
5.2 |
4.8 |
52.0 |
54.4 |
|
Ranges |
32.3-36.2 |
36.0-39.9 |
16.5-18.6 |
15.9-18.2 |
4.9-5.4 |
4.6-5.2 |
50.3-53.4 |
52.8-55.8 |
|
|
1 |
III |
34.4 |
36.3 |
17.1 |
17.2 |
5.1 |
4.9 |
51.4 |
53.5 |
|
Ranges |
31.9-36.2 |
35.3-37.3 |
16.2-18.4 |
16.6-18.2 |
4.8-5.3 |
4.7-5.1 |
49.8-52.8 |
52.6-54.5 |
|
|
2 |
II |
34.4 |
33.7 |
18.3 |
19.0 |
5.2 |
5.1 |
52.6 |
52.7 |
|
Ranges |
31.5-36.0 |
33.2-36.3 |
16.7-19.3 |
17.4-20.1 |
4.9-5.4 |
4.8-5.3 |
50.5-54.1 |
51.6-54.1 |
|
|
2 |
III |
34.7 |
34.0 |
17.7 |
18.6 |
5.0 |
5.1 |
52.5 |
52.6 |
|
Ranges |
32.9-36.9 |
32.7-35.1 |
16.8-18.9 |
18.0-19.6 |
4.7-5.2 |
4.9-5.2 |
51.2-53.9 |
51.9-53.4 |
|
|
2 |
Roundup Ready |
NA |
33.7 |
NA |
18.9 |
NA |
5.1 |
NA |
52.6 |
|
Ranges |
33.3-34.0 |
18.6-19.1 |
5.0-5.1 |
52.5-52.9 |
|||||
|
3 |
II |
NA |
34.8 |
NA |
18.5 |
NA |
5.0 |
NA |
53.3 |
|
Ranges |
33.5-36.2 |
18.2-18.9 |
4.8-5.2 |
52.2-54.5 |
|||||
|
3 |
III |
NA |
34.7 |
NA |
18.6 |
NA |
5.0 |
NA |
53.2 |
|
Ranges |
33.1-36.3 |
17.7-19.4 |
4.8-5.2 |
52.3-54.1 |
|||||
|
4 |
III |
34.6 |
36.8 |
18.3 |
18.1 |
4.9 |
4.8 |
52.8 |
55.0 |
|
Ranges |
31.7-36.2 |
35.1-38.2 |
17.5-19.5 |
17.0-19.7 |
4.6-5.2 |
4.7-5.1 |
51.2-54.3 |
53.7-56.2 |
|
|
4 |
IV |
35.0 |
36.2 |
17.9 |
17.9 |
4.9 |
4.8 |
52.9 |
54.1 |
|
Ranges |
33.3-36.7 |
32.9-38.1 |
17.0-19.0 |
16.8-19.1 |
4.8-5.1 |
4.6-5.1 |
51.5-54.1 |
51.6-55.3 |
|
|
5 |
III |
33.4 |
35.6 |
18.0 |
18.4 |
5.0 |
4.8 |
51.4 |
53.9 |
|
Ranges |
31.2-36.0 |
34.0-37.0 |
17.1-19.4 |
17.7-19.0 |
4.7-5.3 |
4.6-4.9 |
49.8-53.1 |
52.7-54.7 |
|
|
5 |
IV |
31.1 |
36.4 |
19.0 |
19.9 |
5.1 |
4.9 |
50.0 |
54.4 |
|
Ranges |
29.3-32.9 |
33.8-37.9 |
18.0-19.9 |
16.5-18.8 |
4.8-5.6 |
4.7-5.3 |
49.1-51.4 |
52.6-55.8 |
|
|
Average |
34.0 |
35.4 |
18.0 |
18.4 |
5.1 |
4.9 |
52.0 |
53.6 |
|
|
Ranges |
29.3-36.9 |
32.7-39.9 |
16.2-19.9 |
15.9-20.1 |
4.6-5.6 |
4.6-5.3 |
49.1-54.3 |
51.6-56.2 |
|
*Location 1, Porter County-NW Indiana
*Location 2, Tippecanoe County-WC Indiana
*Location 3, Randolph County-NE Indiana
*Location 4, Daviess County-SW Indiana
*Location 5, Jennings County-SE Indiana
Estimated Processed Value (EPV)
The Estimated Processed Value (EPV) is a tool to determine the total value of end products originating from a bushel of raw soybeans on the basis of their protein and oil content. If the yield of soybean meal and extracted oil from a given lot of soybeans is known, the EPV allows users to determine the processed value (the sum of meal, oil, and mill run revenues) from the market prices for soybean meal, crude soybean oil, and mill run. The EPV is affected by soybean protein and oil content, processing characteristics and efficiencies, market prices for soybean meal and soybean oil, and trading practices.
EPV can be calculated by a set of equations that are available in the form of a computer program called SPROC, which was developed by Iowa State University a number of years ago. The advantage of the SPROC program is its capability to process large sets of oil and protein data to determine the EPV for soybean variety trials. An on-line EPV calculator that can be used conveniently for individual samples has recently become available at the following internet site: http://www.stratsoy.uiuc.edu/epv/
This calculator currently requires the user to input the prices for soybeans, meal, oil, and mill run manually. Eventually users will have the option to pull Chicago Board of Trade futures prices for oil and meal into the calculator. Similarly, users must now input the meal and oil content of soybeans manually. In the near future the calculator will be linked to on-line databases containing information on oil and meal content of different varieties of soybeans. Users will then be able to select soybean varieties from this database and compare revenues across different varieties. Our current project on determining the compositional values of soybean samples from the Indiana Soybean Performance Trials will directly contribute to the building of this large on-line database.
Effect of Location on EPV and EPVA
The EPV values of the soybean samples from the Indiana Soybean Variety Trials were calculated using the Iowa State University SPROC program. Prices were based on the 1987-96 average monthly price data from Decatur, IL, with soybean meal at $218.81/ton, soybean oil at $0.254/lb, mill feed at $0.0446/lb, and soybeans at $6.50/bu.
Figures 3 and 4 show the gross income (or agronomic value) per bushel ($/bu) and EPV ($/Bu) by location. The EPV margins in 1997 were larger in all locations compared to 1996. In both years, Location 4 (SW Indiana) had the highest EPV margins. If component pricing structures were in place, farmers in SW Indiana would have received 15.5% and 19.8% more per bushel of their soybeans in 1996 and 1997, respectively. Location 5 (SE Indiana) had the smallest margins in 1996 and Location 2 (WC Indiana) in 1997. These farmers would have earned 4.3% and 14.8% more in 1996 and 1997, respectively. This indicates that farmers located in SW Indiana would benefit the most from component pricing.
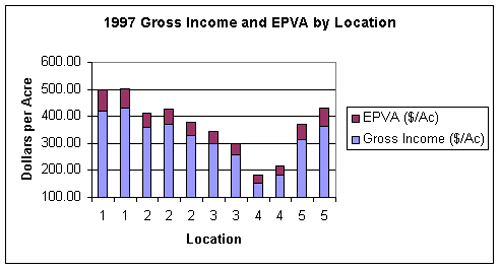
Figures 5 and 6 are graphs of the gross income (or agronomic value) per acre ($/Ac) and the Estimated Processed Value per Acre (EPVA) by location. Agronomic value was calculated using the yield times the 10-year average price, which was $6.50 per bushel. EPVA was calculated using the yield multiplied by the EPV ($/Bu). Every location in 1997 had higher returns in dollars per acre when compared to 1996. However, the districts with the most valuable soybeans were not the same in both years. In 1996, Location 2 (WC Indiana) received the highest agronomic returns and had the largest projected EPVA margin (up to 17.5% of the total). In 1997, Location 1 (NW Indiana) had both the highest agronomic returns and largest EPVA margins (up to 13.4% of the total). Location 4 (SW Indiana) had the lowest agronomic returns and the smallest EPVA margins in both years. However, growers in SW Indiana could have improved their gross income due to component pricing by 15.5% and 19.8% in 1996 and 1997, respectively, which was the highest in the state.
Figure 3 - Gross income in terms of agronomic value and Estimated Processed Value (EPV) per bushel ($/Bu) by location of all soybean varieties in the 1996 Indiana Soybean Performance Test.
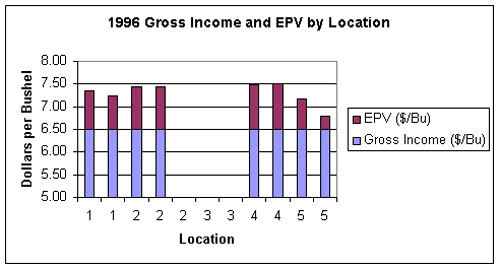
Figure 4 - Gross income in terms of agronomic value and Estimated Processed Value (EPV) per bushel ($/Bu) by location of all soybean varieties in the 1997 Indiana Soybean Performance Test.
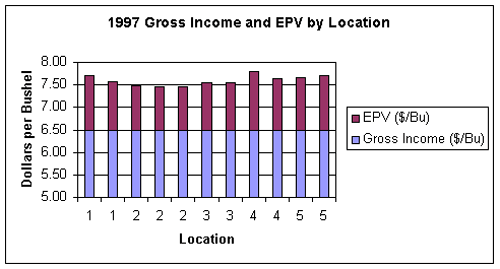
Figure 5 - Gross income in terms of agronomic value and Estimated Processed Value per Acre (EPVA) ($/acre) by location of all soybean varieties in the 1996 Indiana Soybean Performance Test.
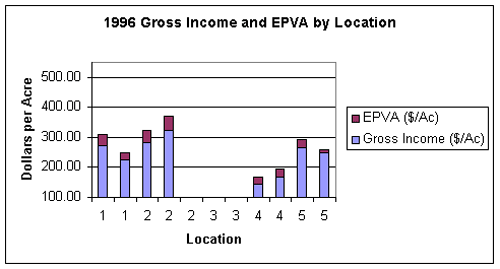
Figure 6 - Gross income in terms of agronomic value and Estimated Processed Value per Acre (EPVA) ($/acre) by location of all soybean varieties in the 1997 Indiana Soybean Performance Test.
Sum of Protein and Oil
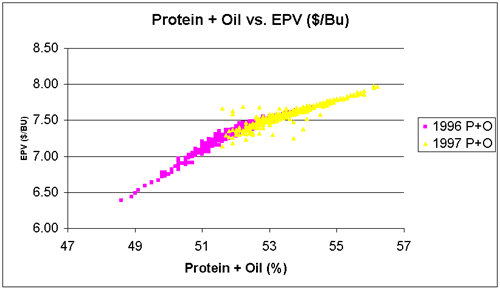
It has been suggested that the sum of protein and oil can be used as a proxy for EPV, eliminating the need for explicit calculations. The American Soybean Association recommends a minimum sum of 54% on a 13% basis for new soybean varieties. It has been shown that when the meal contribution to EPV is 63%, the sum of protein and oil can be substituted directly for EPV. As the meal and oil market prices move away from these conditions, the error in using the sum statistic as a proxy for EPV increases. However, in the absence of EPV data, the sum of protein and oil can be used to estimate the relative value of lots of soybeans with different protein and oil contents.
Figure 7 is a scatter plot of the protein + oil sum versus EPV per bushel ($/Bu) from the 1996 and 1997 data. Overall, there was a fairly linear correlation between the protein + oil content and the EPV. The protein + oil content was higher in 1997 than in 1996. Recent research by Iowa State University defined high processing value soybeans as being 0.5 standard deviations above the average protein + oil sum for a particular plot test. Extra high processing value soybeans were defined as being one standard deviation above the average protein + oil sum. When evaluated for Iowa conditions, those limits gave the high value soybeans at least a 7 cents/bu gain above the average EPV, and the extra high value soybean varieties gained at least 15 cents/bu in value. It is estimated that both in 1996 and 1997 approximately 20% of Indiana soybean varieties in the top 50% by agronomic yield had high enough protein + oil sums to generate at least 7 cents/bu additional processing value. About 10% of varieties could have generated an additional 15 cents/bu or more for farmers.
Figure 7 - Scatter plot of the protein + oil sum vs. Estimated Processed Value (EPV) per bushel ($/Bu) of all soybean varieties analyzed as part of the 1996 and 1997 Indiana Soybean Performance Tests.
Summary
Iowa State University research indicates that marketing soybeans based on end-use characteristics would theoretically benefit Indiana farmers by more than $14 million annually. Based on our current data, farmers in SW Indiana would benefit the most on a per bushel basis, while farmers in NW and WC Indiana would benefit the most on a per acre basis from this change to a traits-based marketing system. Additional research is needed to confirm these trends over multiple years and to maximize the end-use value through better variety selection and improved site-specific farming practices.
For more detailed information concerning the composition data for each soybean variety in the soybean performance test, please visit the World Wide Web at: http://pasture.ecn.purdue.edu/~grainlab/ext-proj-current/grain-composition.htm (Choose Summary Data for Indiana Corn and Soybeans). For further information on this project, or on how to submit your soybean and corn samples for composition analysis FREE of charge, call (765) 494-2285, or send e-mail to: grainlab@ecn.purdue.edu
Additional Resources
B 759, Performance of Public and Private Soybeans in Indiana, 1997, which is available on-line at: http://www.agry.purdue.edu/ext/soybean/variety/soy97txt.htm
Acknowledgment
The authors are grateful to Drs. Richard Stroshine and Sam Parsons for their critical review of this fact sheet.
Grain Quality Fact Sheets can be accessed on-line through the World Wide Web at:
http://www.extension.purdue.edu/extmedia/grain.htm
(select) Grain Quality
or http://pasture.ecn.purdue.edu/~grainlab
(select) On-Line Extension Publications
(select) Grain Quality Fact Sheets
Almanac: send e-mail to: almanac@ecn.purdue.edu message:
send grain guide
or send grain catalog
or send grain factsheet #39 (for example)
or send acsonline GQ-39