
GQ-41
| District | Harvested Acres (1000's) |
Acres per Samples |
Yield (Bu/ac) | Production (1000 Bu) |
Production (1000 Bu) per Sample |
|---|---|---|---|---|---|
| NW | 765 | 76,500 | 44 | 33,723 | 3,372,300 |
| NC | 632 | 126,400 | 46 | 29,325 | 5,865,000 |
| NE | 611 | 305,500 | 43 | 26,029 | 13,014,500 |
| WC | 697 | 232,333 | 42 | 29,395 | 9,798,333 |
| C | 1,248 | 178,286 | 44 | 54,687 | 7,812,429 |
| EC | 532 | 177,333 | 42 | 22,097 | 7,365,667 |
| SW | 692 | 138,400 | 36 | 24,804 | 4,960,800 |
| SC | 194 | 194,000 | 35 | 6,869 | 6,869,000 |
| SE | 229 | 0 | 36 | 8,271 | 0 |
| State | 5,600 | 155,555 | 41 | 235,200 | 6,533,333 |
| 1997 | 5,400 | 122,727 | 44 | 437,600 | 5,400,000 |
| 1996 | 5,360 | 148,889 | 36 | 203,680 | 5,657,778 |
| 1996 | ||||||
|---|---|---|---|---|---|---|
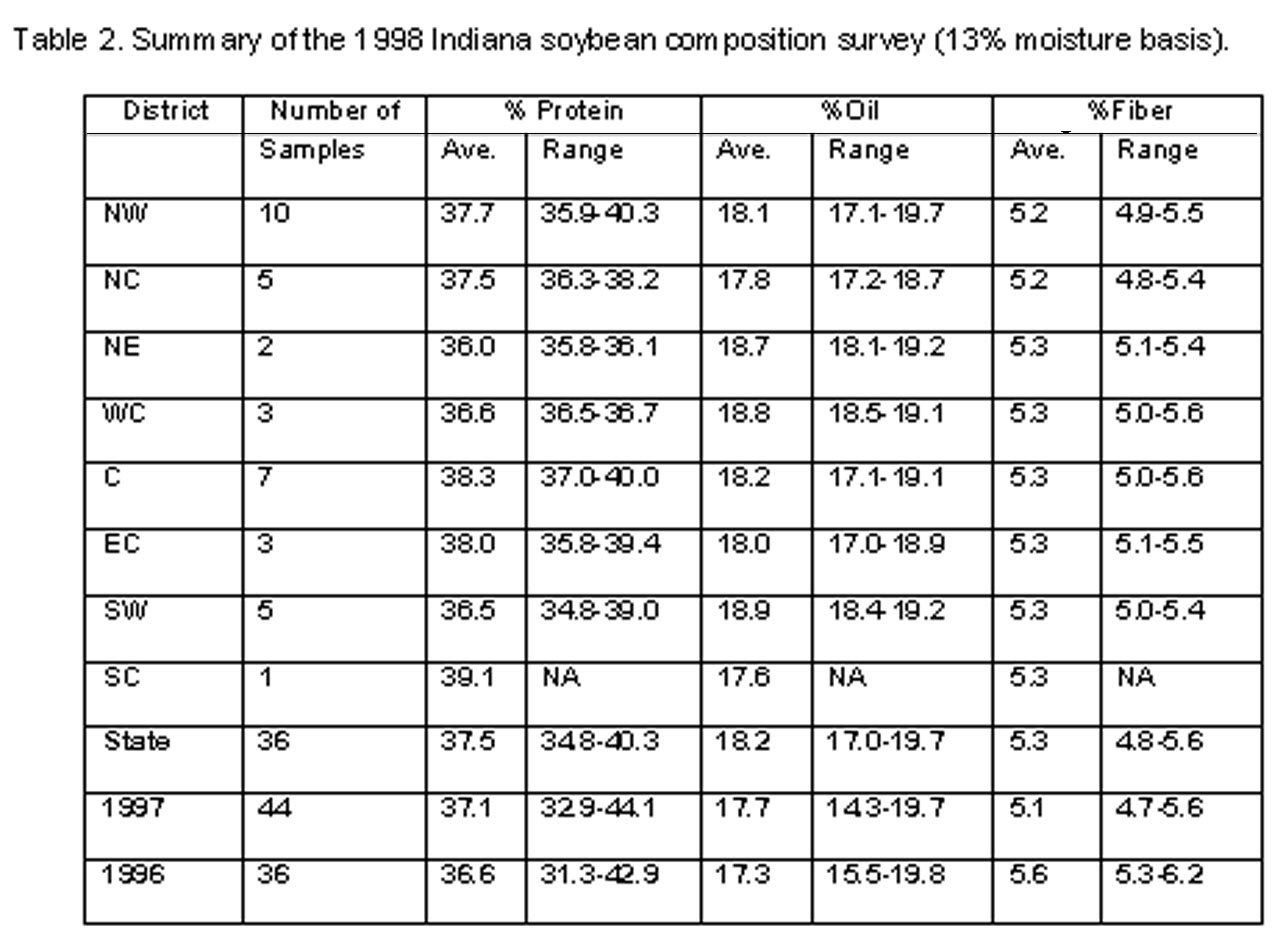
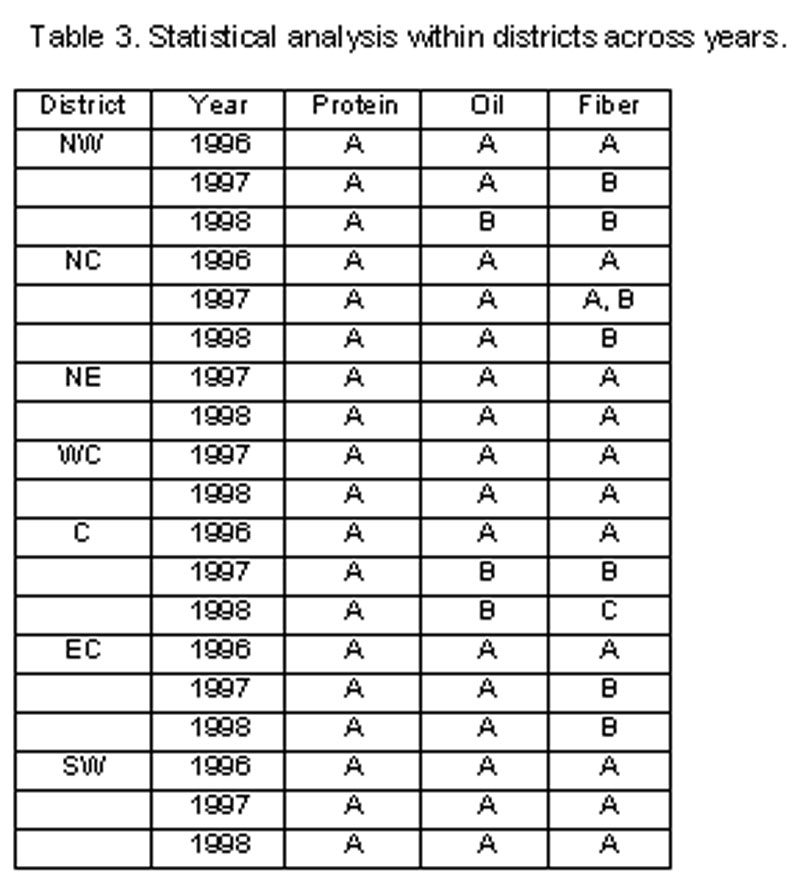
| District | Protein | Average | Oil | Average | Fiber | Average |
| NW | A | 36.83 | A | 16.67 | A | 5.67 |
| NC | A | 37.54 | A,B | 17.19 | A | 5.47 |
| C | A | 36.68 | A,B | 17.19 | A | 5.65 |
| EC | A | 34.45 | A,B | 17.15 | B | 5.95 |
| SW | A | 36.17 | B | 18.37 | A | 5.57 |
| 1997 | ||||||
| District | Protein | Average | Oil | Average | Fiber | Average |
| NW | A | 37.74 | A | 17.03 | A | 5.01 |
| NC | A | 37.64 | A | 17.10 | A | 5.34 |
| NE | A | 37.13 | A | 17.30 | A | 5.07 |
| WC | A | 36.75 | A | 17.30 | A | 5.15 |
| C | A | 36.72 | A | 18.25 | A | 5.03 |
| EC | A | 35.45 | A | 18.15 | A | 5.15 |
| SW | A | 37.25 | A | 17.95 | A | 5.30 |
| 1998 | ||||||
| District | Protein | Average | Oil | Average | Fiber | Average |
| NW | A | 37.71 | A | 18.10 | A | 5.18 |
| NC | A | 37.48 | A | 17.78 | A | 5.20 |
| NE | A | 35.95 | A | 18.65 | A | 5.25 |
| WC | A | 36.60 | A | 18.77 | A | 5.30 |
| C | A | 38.29 | A | 18.17 | A | 5.31 |
| EC | A | 38.03 | A | 18.00 | A | 5.33 |
| SW | A | 36.48 | A | 18.90 | A | 5.28 |
|
Grain Quality Fact Sheets can be accessed on-line
through the World Wide Web at: http://www.extension.purdue.edu/extmedia/grain.htm (select) Grain Quality or http://pasture.ecn.purdue.edu/~grainlab (select) On-Line Extension Publications (select) Grain Quality Fact Sheets Almanac: send e-mail to: almanac@ecn.purdue.edu message: send grain guide or send grain catalog or send grain factsheet #41 (for example) or send acsonline GQ-41 |