NCR-406-W
Farmers make decisions in a risky, ever changing environment. The consequences of their decisions are generally not known when the decisions are made, and outcomes may be better or worse than expected. Variability of prices and yields are major sources of risk in agriculture. Changes in technology, legal and social concerns, and the human factor itself also contribute to the risky environment for farmers. Risky situations of concern are typically those in which 1) there is a high possibility of adverse consequences and/or 2) the adverse consequences, should they occur, would cause significant disruptions.
Farmers and other business people generally do not get into risky situations unless there is a probability of making money. Higher profits are typically associated with higher risks. It is to their advantage that these risky but potentially profitable situations be managed as carefully as possible. Effective risk management involves anticipating possible difficulties and planning to reduce their consequences, not just reacting to unfavorable events after they occur. The two primary aspects of risk management are: 1) anticipating that an unfavorable event may occur and acting to reduce the probability of its occurrence and 2) taking actions which will reduce the adverse consequences should the unfavorable event occur.
For example, risk management in the machinery area might involve a complete overhaul of an old tractor before the busy season to reduce the chances of a major breakdown. Also, during planting and harvesting, most farmers keep some key spare parts readily available. While the spare parts do not prevent a breakdown from occurring, the unfavorable consequences are reduced.
Some responses to risk, like hedging, may narrow the range of possible outcomes. With hedging, a farmer gives up the chance of a very high price, but is protected from a low price. Other risk responses, like insurance, may involve paying a premium to eliminate the consequences of a ``bad'' event. All of the responses to risk involve a cost, whether explicit like the insurance premium or implicit like the possible high price given up. A risk management strategy is developed using a variety of the available responses to risk.
Individuals are not the same, nor are their personal and financial circumstances. This publication is designed to help farmers develop their own integrated risk management strategies, ones appropriate to their own attitudes and circumstances. First, the publication reviews factors affecting decision making in a risky environment. Then it discusses sources of risk, producers' views of variability, and information to improve decision making. Third, it outlines risk management strategies available to producers. The publication concludes with a brief discussion of development of an overall risk management strategy.
Making decisions would be easy if we knew what the outcome was going to be. We have all probably made statements like: ``If I'd known this was going to happen, I never would have done it''; ``If I'd known that corn was going to drop $.10 a bushel, I'd have sold last week''; or ``If I'd known that hog prices were going that high, I'd have bred more sows.'' The consequences of a decision are generally not known when the decision is made. Nonetheless, decisions must be made and actions taken (taking no action is also a decision).
Decision making involves setting your goals and objectives, identifying the problem, determining your alternatives, evaluating these alternatives, selecting an alternative, implementing that alternative, and bearing responsibility for the outcome. Decision making in a risky environment also involves attitudes toward risk, ability to bear risk, and formation of expectations about the future. The decision making process is complex, and farmers differ both in how they make decisions and in the decisions they make.
This section focuses on the factor that are important when decisions must be made in a risky environment. Attention is first briefly directed at setting farm family goals. Then types of individuals and their risk attitudes are discussed. (A ``quiz'' intended to help an individual gain a better understanding of his or her attitudes toward risk is included in Appendix A.) Next, the way individuals differ in their financial ability to bear risk is discussed. The section concludes with a discussion of the formulation of expectations. (Elements for decision-making under risk, which deals with probabilities, measures of variability, and how expected values can be calculated are included in Appendix B.)
Where are you headed? What do you want? These are questions which face everybody. Most of us do not have very definite answers to these questions. Often, unless there is some kind of pressure (family crisis, investment opportunity, etc.), we tend not to think about our goals and objectives very much. We may have a ``to do'' list, but commonly our goals or objectives are vague and indefinite.
Setting goals requires some time and thought. If we think about our goals and objectives, we would probably find that we could identify a number of goals, some short-term and other long-term goals. Most people have family, business, and personal goals. Typically, we will have some goals that will compete with and others that complement one another. We need to be aware of these interrelationships among our goals.
A second point is that our goals are not independent of other people and their goals. Spouses, children, parents, and others play an important role. Even our purely personal goals are likely to have effects on these other individuals. If we are vague about our own goals, how much do we know about others' goals? How many times have family difficulties developed because one person did not know what another was trying to accomplish?
Goal setting is important because goals are a major part of our guidance system. Decisions can be made concerning the likely effects that alternative actions will have on our goals. Goal setting is a dynamic process. A goal may be achieved, and this should be a source of a feeling of accomplishment. New goals may become important to us. The priorities of various goals can also change over time. Individuals may have unrealistic goals which, if not revised, may be a source of frustration and stress.
Risk has many meanings. Some dictionaries define ``risk'' as ``the possibility of injury, damage or loss.'' Economists argued about ``risk'' vs. ``uncertainty'' for years. They finally decided that the lack of knowledge about the future is what is important in both risk and uncertainty. For example, we don't know what the price of corn will be in December. Perhaps corn will be $2.75, with a range of $2.25 to $3.25. If equally likely, economists tend to treat the $2.25 and $3.25 prices as the same from a risk standpoint. However, corn producers are much more concerned about the possibility of a $2.25 price than they are about the $3.25 price. In contrast, livestock producers buying corn are more concerned about the possibility of the $3.25 price.
Jerry Robinson, Jr., professor of sociology and rural sociology at the University of Illinois, classifies individuals in the following risk-taking categories:
1. ``Avoiders''
2. ``Daredevils''
3. ``Adventurers''
4. ``Calculators''
The ``Avoiders'' are the most cautious risk takers, but they do take some risks. They expect the worst to happen and will not take the slightest chance that they can avoid. They lose because they miss economic opportunities to profit. Farmers who are Avoiders may not be forced out of business, but they just manage to survive. Their farms usually disappear (being absorbed by a neighboring farm) when they retire or die.
``Daredevils'' are the opposite of the Avoiders and take many unnecessary chances. Daredevils are the plungers who close their eyes to risk, ignore facts, and go ahead. Daredevils commonly fail because they refuse to take precautions. Daredevils typically do not get involved in farming.
``Adventurers'' are individuals who enjoy risks. To Adventurers, risks are challenging and exciting. Often Adventurers look for the chance to take risks. Adventurers differ in their mental outlook. Some Adventurers enjoy the excitement of risk taking, but keep the stakes to reasonable levels. Many farmers may be in this category with respect to their marketing plans. As long as financial survival is not at stake, they may enjoy the adventure of playing the market. Many speculators are in this category. However, some Adventurers may get in over their heads. This may be from peer pressure or from a change in external conditions.
``Calculators'' understand they must take some chances to get ahead, but recognize that there are degrees of risk in every situation. Before making a decision or taking action they gather information and analyze the odds. Calculators try to be realistic, recognize the risks, and try to reduce risks to acceptable levels. Most farmers are Calculators, at least in the majority of their decisions.
                                Oscar           Sam             Bob
Item                            Owner           Sharerent       Buyer
_________________________________________________________________________

Land                            $400,000        $      0        $400,000
Machinery                       +100,000        +100,000        +100,000

Total Assets                    500,000         100,000         500,000
Liabilities                     -50,000         -50,000         -350,000

Net Worth                       $450,000        $ 50,000        $150,000
Debt/Asset Ratio                     .10             .50             .70
Cash Requirements               $ 73,000        $ 54,000        $112,000
Expected Gross                  $120,000        $ 60,000        $120,000
Cash Required/Expected Gross       60.8%            90.0           93.3%
_________________________________________________________________________
Risk management strategies are also affected by an individual's ability to bear (or to take) risk. Simply stated, risk bearing ability is directly related to the solvency and liquidity of one's financial position.
Risk bearing ability is also affected by cash flow requirements. Cash flow requirements are the obligations for cash costs, taxes, loan repayment, and family living expenses that must be met each year. The higher these obligations as a percentage of total cash flow, the less able the farm firm is to assume risk.
To illustrate the differences in risk bearing ability, assume we have three farmers operating 400 acres with the same type of machinery. Their simplified balance sheets and cash flows are indicated in Table 1.
From a cash flow and financial position of the business standpoint, Oscar Owner is able to assume considerably more risk than either Sam or Bob. Although Sam Sharerent requires less cash annually than Bob Buyer and has a larger cash flow cushion, Bob does have a larger net worth base on which to fall back. For example, a 16.7 percent or $20,000 reduction in gross farm income ($10,000 in the case of Sam) results in a cash flow shortfall of $6,000 for Sam and $12,000 for Bob. However, the $6,000 cash flow shortfall represents 12 percent of Sam's net worth, but the $12,000 shortfall is only 8 percent of Bob's net worth.
Expectations about the future are also factors in decision making. For instance, expected prices for corn and soybeans have some impact on farmers' planting decisions. Investment decisions implicitly or explicitly involve expectations about future prices, costs, yields, and a number of other factors. No doubt the past has a significant impact on most expectations for the future. However, exactly how individuals form their expectations is unknown. Furthermore, all individuals probably use somewhat different procedures.
People tend to have selective memories. If the tractor recently broke down, they tend to overestimate the probability of a breakdown. Extreme events are sometimes remembered and given excessive weight in expectations. However, people who have not experienced a particular event, like the severe drought of 1988, may underestimate the probability of that event.
The recent past tends to be weighted more heavily than events occurring some time ago. This is part of the explanation for the hog and cattle cycles. In other situations, when circumstances have changed, the past may provide very little basis for future expectations. Basing future expectations on the past implicitly assumes that the factors responsible for past events will continue in the future. Long run expectations based on recent changes can be especially misleading. Some farmers assumed that land values would continue to increase based on their experiences in the 1970s. But very strong trends are likely to experience reversals, as land values demonstrated in the mid-1980s.
Formulating expectations is an important phase of the decision making process, and it involves judgement. Most farmers rely heavily on personal experience, but supplement this with other information. Futures prices and outlook information, as well as a view to the past, can be helpful in formulating price expectations. Short-run expectations are generally more precise than long-run expectations because more information is available. Technical materials, discussion with other farmers, and expert opinion can play a major role in formulating other expectations. Expectations are personal, and each individual has his or her own. However, individual differences in goals, attitudes toward risk, and ability to bear risk also affect decision making under risk.
Risks can be classified in several ways. One useful classification is to consider business and financial risks. Business risks are those associated with farming which are independent of the farmer's financial circumstances. These would include variable yields, fluctuating prices, and many other factors which make the consequences of a decision unknown. Financial risks are the additional risks faced by a farmer who has less than total equity in the farm operation. Availability of loan funds and the costs of credit are some examples of additional financial risks. Less than full equity in the farming operation also may magnify the good or bad consequences of decisions, affecting the individual's capacity to bear risks.
Business risks for the farm operator can be classified according to their sources.
Market or price risk is associated with the purchase of inputs as well as the sale of commodities. Fluctuations in input and output prices cause income gains or losses. These fluctuations can occur within a marketing year as well as between years. Net worth may also be affected if prices of inputs such as land and machinery change. Availability of inputs is also a risk. And, in the longer run, the variability of prices, interest rates, and relative prices are risk factors which influence many decisions.
Production risk is the random variability inherent in a farm's production process. Weather, diseases, and pest infestations lead to production risk in crop and livestock activities. Fire, wind, theft, and other casualties are also sources of production risk.
Technological risk is the potential that current decisions may be offset by dramatic technological improvements in the future. There is the risk that durable assets will become obsolete. The rapid changes in personal computers and conservation tillage are current examples. Developments in the nonfarm sector can also affect farming; for example, more sensitive instruments to detect residues may change production practices.
Legal and social risks include things like government price and income programs, tax, trade, credit, and environmental policies, all of which have impacts on the operating environment. These risks may increase as firms get larger. New risks may result from new developments. Forward contracts and minimum price contracts, for instance, introduce the risk associated with the integrity of the contractor.
Human sources of risk are associated with the labor and management functions in farming. Health problems of key individuals can severely disrupt farm performance. Furthermore, changing objectives of individuals and family members can have major effects on a farm's long run changes and viability.
A study was conducted in 12 states to determine which sources of variability are important and how the importance differs geographically.** A small number of producers were asked to indicate what they considered to be the most important sources of variability in crop and livestock production. Weather and output prices were selected as the most important sources of variability in crop production. Livestock prices were the leading source of variability in livestock production, with operating input costs being slightly more important than weather.
Midwestern farmers considered diseases and pests as more important sources of variability in livestock production than in crop production. This was generally a contrast to other areas of the country. The midwestern farmers gave greater importance to safety and health, family plans, inflation, and the world economic and political situation than producers in the other regions. Government commodity programs as well as government laws and regulations were considered less important by midwestern producers as a source of variability in crop production than by producers in other areas.
Producers' views of the importance of different sources of variability also differed with their individual circumstances. Farmers operating primarily rented land considered changes in the availability of land and conditions of leasing as much more important than farmers who operated primarily owned land. The availability and cost of credit, as would be expected, were more important as sources of variability for farmers with considerable indebtedness than those with little or no debt.
The most useful asset a producer can have to help with the management of risk is good information. There are many sources of information available to the producer. The most appropriate place to look for information depends on the type of risk with which the farmer is concerned.
The best source of historical production and marketing information is (or should be) the farm records maintained for the farm business. The records may be supplemented and complemented by off farm information, forecasts, and predictions. But there is no substitute for farm record data.
The crop yield, livestock production, and cost information generated by farm records reflect the production capabilities of the specific assets controlled by the business. The business management capability is also reflected for both production and marketing aspects of the business. As such, this record information should provide insights into the actual production and price variability experienced by the farm business in the past.
This individual farm information should prove useful in a number of ways. It should provide a good picture of the risk faced by the business in the past. The records should also indicate how successful past risk management efforts have been. Combining these historical results with the producer's risk preferences should point out what, if any, changes in risk management should be made in the future.
Is the farm primarily bottom land prone to flooding? Are hills which are susceptible to drought a major problem? Have these situations contributed to greater yield variability than desired? Which crops are the worst? Can crop mix or rotation be changed to provide more desirable results? Would a change in cultural practices, tillage systems, or operation timing help to reduce yield variability to a more desirable level? Are crops always sold at harvest? Is grain sold when the operating note comes due? Has this marketing method (as opposed to a marketing plan) produced greater price variability than desired?
The information provided by farm records should help answer these questions. If past production and marketing decisions have not provided desirable results, the records should show it. Record analysis should also point out things that should be changed to provide better results that are more compatible with the manager's risk preferences.
The kind of information not available from on farm sources is that concerning technological, human, legal, and social risk. Farm records should prove useful in providing information about past decisions in these areas. But they will provide little information about what is going to happen in the future in these areas. Off farm sources are required for this information.
Information from other than farm sources can prove useful in the management of all aspects of business risk. Your state Agricultural Statistics Service, Cooperative Extension Service, and other USDA agencies as well as consulting advisory services, newsletters, magazines, agricultural suppliers, and neighbors can all prove to be valuable sources of information for a producer.
                Average         Variability
Crop            (bu./A.)        (%) *
________________________________________________________________
                        Indiana **

Corn            94.8            18.1
Soybeans        31.5            15.7
Wheat           40.8            14.9

                    Tippecanoe County

Corn            101.0           20.6
Soybeans        33.1            17.6
Wheat           44.6            17.5

                     Typical Farmer

Corn            111.1           22.7
Soybeans        36.4            19.4
Wheat           49.1            19.3
________________________________________________________________
* Coefficient of variation in percent.
** State and county information from Department of Agricultural
   Statistics, Purdue University.
________________________________________________________________
Historical state yield and price information should be available from the Agricultural Statistics Service. This information can prove useful when compared to the data generated by farm records. How does the price and yield variability (risk) experienced by your business compare with the state or county average? Table 2 provides comparisons of yield results for a typical farmer in Tippecanoe County, Indiana from 1965 to 1990. This data indicates that, over the 1965-90 period, the greatest variation (risk) was experienced in corn production. Wheat was the least risky. More important, it also shows the yield variability increases as we go from the state to the farm level. This is the usual situation! As the geographic base of observations is enlarged, the variation is decreased. As it is made smaller, the variation is increased. This is true simply because the larger number of observations tend to even out results. Again, this emphasizes the importance of individual farm information to the management of risk for the farm business.
Similar comparative information to that contained in Table 2 may be available from Farm Record Analysis programs sponsored by the state Cooperative Extension Service. Program participant averages will typically be broken down by commodity, geographical area, and size of operation. Comparing historical farm business performance to that of similar farms in the same area should provide additional insights into which aspects of the risk management function may need improvement.
Market situation and outlook information is available from many sources. The Cooperative Extension Service, marketing advisory services, farm magazines, and newsletters all provide an analysis of the current situation and market outlook for most agricultural products. The type of information offered ``covers the waterfront.'' It may be a relatively simple comparison of the current supply and demand situation to that of last year, with some projection of what direction the market is headed. Or it could be a service that provides up to the minute cash, futures, and option prices in combination with computers and software to analyze the information and provide marketing advice.
The type of market information needed by a producer depends on many things. However, in the final analysis it comes down to the fact that the farmer cannot pay more for the information than it is worth in the management of the business. This depends on the size, type, and complexity of the farm business. This fact is also the reason why so many different sources and types of information are available. If a producer is not pleased with the results of a particular marketing plan, there may be a need to use a different kind or source of information.
The management of technological, human, social, and legal risks also requires the use of off farm information. Primary sources of information would be the same as those used for market outlook data.
The major difference between information pertaining to production and market risk as opposed to technical, human, social, and legal risk is that the latter is qualitative in nature. A manager can get ``hard numbers'' to quantify yield and price. The same cannot be said of the other risks. The best available information will only indicate general trends that are taking place in the industry. These trends concerning technical, human, social, and legal risk can be quite important in the management of the farm business. Examples of topics on which information of this nature might prove important could include: environmental legislation, resource conservation, food safety, water quality, animal welfare, and farm programs and policies, to name only a few. Realization of the importance of these issues and good information about them could help the producer avoid ``bad'' decisions in both the short and long run. Elimination of such decisions should improve the manager's ability to manage technical, human, social, and legal risks.
Risk management strategies are developed to provide some protection in situations in which the consequences of a decision are not known when the decision is made. Risk management strategies consist of a variety of responses which may reduce the probability of an unfavorable event occurring and/or reduce the adverse consequences if the event occurs. However, in gaining protection from a possible loss, part of the potential gain is generally given up. In other words, most responses to risk have a cost associated with them, even if it is not explicit. Generally, farmers would like to avoid major losses, but would also like to be in a position to benefit from favorable events. The trick is to effectively manage risk without unduly sacrificing gains.
Risk responses or methods of dealing with variability are commonly grouped into production, marketing, and financial responses. As the names imply, production and marketing responses deal directly with the production and market types of risk. Production responses generally act to reduce risk by reducing the variability in production. Marketing responses may also reduce risk by narrowing the range of possible outcomes or may involve transferring price risks to other individuals or institutions. In contrast, financial responses generally emphasize the firm's capacity to bear risk and do not reduce the probability of an unfavorable event. ``Going broke'' may be expressed as a risk, but it is really the consequence of one or more other risks. Financial responses, such as insurance, may also transfer risks to others and provide the means with which the firm can withstand adverse consequences should they occur.
The various risk responses have different effects on the farm business, but none of the responses can provide protection from all types of risks. As a result, most farmers use a combination of production, marketing, and financial responses in their risk management strategy. Because farmers differ in their goals and attitudes, as well as their personal and financial situations, their risk management strategies also differ.
There are a number of production responses to variability which can be made by farmers. These responses generally involve trading a reduction in the level of average income for reduced year to year variability of income. Production responses have traditionally been very important in risk management, but they have declined in relative importance as farms have become larger, more specialized, and more capital intensive.
The selection of crop and livestock enterprises can affect the production variability faced by farmers. Often there is little difference in the yield variability (Table 2) of the most common crops in a county or state.
The yield variability of individual farmers is likely to be considerably greater than that indicated by county or state average yields. Farmers are also likely to be aware of differences in the yield variability of crops associated with soils, management, and other factors on their own farm. Because of these factors, an enterprise may be considered a high risk activity by one farmer and a low risk activity by another.
Specialty crops, such as tomatoes and vegetables for processing, commonly have greater year to year production variability than the more common crops. Although specialty crops may offer the possibility of high gross returns, they may also involve higher production costs and difficulties in finding marketing outlets. Because of these factors, specialty crops would not be considered low risk activities for most producers.
Some farmers may undertake only part of a production activity as a means of reducing risk. For example, custom cattle feeding largely eliminates the marketing and financial risks faced by the producer. Custom work and custom farming are other examples of undertaking only part of an activity to reduce risk.
Diversification is a risk management technique traditionally used by farmers. If one enterprise did not do well, the farm had other enterprises on which to rely. Returns were generally not as high as with specialization, but year to year variability was reduced.
Economics and agronomics lead many cornbelt farmers to a corn/soybean rotation. Costs are reduced and yields improved relative to continuous corn. In addition, because corn and soybean yields do not vary exactly together, there are risk reduction benefits from diversification. Diversification may also result in greater timeliness of operations and in increased returns. For most farmers, combining corn and soybeans is not risk management--it is good management! Risk management begins after these production efficiencies are gained.
Some factors can work against diversification in crops. For example, corn and soybeans use similar machinery and equipment, but many specialty crops which can be grown may require special equipment. Thus the benefits of diversification may be offset by increased costs. Other crop enterprises may provide very low returns to capital, labor, and management. Although variability could be reduced by including these enterprises in the farm business, most farmers are unwilling to accept the reduced income which also results.
Combining livestock with crop enterprises is a common means of diversification on many midwestern farms. Although relatively small hog and/or cattle operations are common on many farms to utilize surplus resources, there is increasing specialization of livestock enterprises.
This trend toward increased specialization suggests that cost savings associated with specialization and size more than offset the benefits of diversification for many farmers. However, with the decline of diversification, farmers need to be aware of the need for other management responses to risk.
Geographic dispersion of production activities reduces the impact of localized weather conditions. Availability of land for rent or purchase has some impact on this. Often, farmers trying to increase the size of their crop operations must farm over a wide area. However, farmers also recognize the added costs of operating over a wide area. Often farmers have a variety of soil types, some heavy and some lighter soils within a limited geographic area. Having some ground which they can work early is one way of spreading risk as well as getting increased efficiency in machinery and labor use.
Selection and diversification of production practices is fairly common. Usually, production practices are selected because they are effective under a variety of situations. Planting several hybrids with different pollination dates and applying different herbicides are examples of production practice diversification.
Production practices selected may be informal insurance schemes. Many farmers routinely use antibiotics in livestock feed or use insecticides and other chemicals in crop production even though these inputs are not always required. Maintaining excess machinery capacity or feed reserves to offset unfavorable weather are other examples. The periodic overhaul and routine maintenance of machinery and equipment are also means of reducing the probability of breakdowns during critical times. The costs of the additional antibiotics, insecticides, chemicals, machinery, and feed reserves must be compared with possible losses when not using these inputs.
Farmers commonly attempt to maintain flexibility in their operations as a production response to variability. Increasing specialization of livestock facilities and equipment limits flexibility among types of livestock, and often there is a similar situation with respect to crops. Farmers are likely to maintain flexibility more in their marketing and financial decisions than in the type and size of production activities. Often the costs associated with flexibility in production are higher than most farmers are willing to incur.
Idling acreage and varying livestock production with changes in economic environment is another form of flexibility. Land may be idled as required for participation in government programs, but generally not as a production response to risk. Some hog producers do vary their use of facilities depending on expected conditions. If they think prices will be good, they increase production by crowding facilities. Conversely, they try to increase efficiency and cut costs if expected prices are not good. The fixed cost component of many livestock operations is large, thus, in most situations the facilities are utilized rather than left idle to minimize losses.
There are a number of production responses to variability available to midwestern producers, but the effectiveness of these responses may be limited. Economic and agronomic considerations often limit the possibilities of enterprise diversification and geographic dispersion of production for many producers. Flexibility in operations and production capacity also have only limited roles as management responses to variability. Selection and diversification of production practices is the primary production response available for risk management.
Farmers would probably describe their production response to variability as ``being a good farmer.'' For many farmers this means having low production costs per unit to increase the profit margin and to provide a cushion for adversities such as low prices or yields. Often this will involve a number of the production responses discussed.
The increased variability of commodity prices has increased farmers' awareness of price risks and placed a premium on good marketing skills. Many farmers have attempted to improve their knowledge of marketing and develop new marketing skills. New marketing responses to variability, like options trading and minimum price contracts, are being developed.
Some marketing responses reduce risk by reducing variability, but other marketing responses involve the transfer of risks to others. Commonly, producers utilize a combination of the marketing responses in their farm operations.
Most farmers indicate they follow the commodity markets regularly. Many farmers also obtain outlook information, chart or use charting services, and subscribe to various marketing services. Obtaining market information is not difficult, according to many farmers, but obtaining ``good'' information is.
Acquiring market information does not constitute a response to risk or variability. Although acquiring market information is a starting place, this information must be combined with other actions before there is an effect on price and income variability.
Participating in or maintaining eligibility for government commodity programs is a marketing response to variability used by many producers. Government programs provide downside price protection for some commodities. At different times, this protection has taken the form of price supports, loan programs, target prices, deficiency payments, and payments in kind. Cost of this protection has varied by commodity and from year to year. In some instances, there have been no restrictions on eligibility for participation, thus the government program has functioned as no cost price insurance. Acreage controls, set asides, reduced marketing flexibility, and storage requirements have been associated with other government programs. Generally, the costs of participation have been higher when potential benefits from participation have also been higher.
Typically, farmers can determine whether to participate in a government program on an annual basis. Participation in one program may require participation in other applicable programs (cross compliance). However, farmers can analyze potential effects of participation or nonparticipation based on their individual circumstances and specifics of the program. Participation may be advantageous in some years and not in others.
The spreading of sales, making several sales of a commodity during a year, is commonly used by agricultural producers. Dairymen and many other livestock producers are forced to spread their marketing over the entire year because of the nature of their production. With frequent sales throughout the year, the average price received by a producer is nearly equal to the season or annual average price.
Producers with marketing flexibility can also spread cash sales and obtain a price similar to the season average price. This procedure enables a producer to avoid selling all of the production at the bottom of the market. Spreading sales guarantees that the producer's average price will be close to the season average price, but also guarantees that the price received will not be much above average. Furthermore, although spreading sales throughout the year essentially averages out the within year variability, it does little to reduce year to year variability.
The practice of forward contracting can be used for both inputs and outputs. Some farmers contract needed quantities of inputs at specified prices to avoid the risk of price increases and unavailability of inputs. Similarly, some producers forward price some of their production. Although farmers differed in their views of forward contracting, almost 77 percent of the producers interviewed in the 12-state-study did some forward contracting of production or needed inputs.
Hedging, the use of futures contracts, is another marketing response which has the potential for reducing risk. Farmers can sell commodities on the futures market and assure themselves of a price, except for basis changes. Futures contracts are also available on some inputs used by some farmers, especially livestock feeders. Futures contracts introduce additional flexibility into an individual farmer's marketing responses.
A marketing response which has recently become available in some agricultural commodities is options trading. Agricultural options provide a farmer with the opportunity to secure price insurance. However, options will not always be able to guarantee a profit. Options can eliminate the negative financial impacts of an adverse price move and allow the farmer to share in the positive financial impacts of a favorable price move. Costs associated with options trading may be higher than an individual anticipates.
Minimum price contracts and other marketing arrangements are being developed based on options. These new marketing techniques provide producers with greater flexibility and more risk management alternatives.
Most marketing plans or marketing strategies use several of the market responses discussed above. Typically, a farmer may combine futures contracts hedging, options, or forward contracting with cash sales. Sales may be made at several points during the overall marketing period, a way of spreading sales.
Some strategies are linked to costs or returns: ``Price when total production costs are covered.'' Other strategies deal with timing: ``Price around the seasonal high.'' Fundamental and technical analyses are commonly used to determine selling strategies. Some people follow routine strategies, while others attempt to vary their strategy in response to market information.
Researchers and Extension economists have analyzed a number of marketing strategies. Pricing based on costs of production tends to increase price and reduce variability when positive margins exist in the market. Price protection is also provided when margins are negative, but many farmers hesitate to lock in a loss even if the possibility of further losses is eliminated. Timing strategies based on cyclical and seasonal price factors can be effective. One conclusion is clear: the same strategy does not work all the time. Furthermore, there is no guarantee that a strategy that has worked well in the past will be successful in the future. Therefore, farmers need to continually analyze and evaluate their marketing strategies, making improvements as conditions change.
As farms have become larger and more specialized, use of production responses such as enterprise diversification has diminished. Use of marketing responses to reduce risk has increased with the greater variability of commodity prices, but price variability has not been eliminated. As a result, the importance of financial responses to risk has increased.
Financial responses to risk generally affect the firm's solvency (debt/equity ratio) or liquidity positions. During the late 1970s, many farmers found their solvency increasing with rising land values. In periods of decreasing land values, such as the mid-1980s, solvency typically declines. Managing the pace of investments and withdrawals, as well as the means of asset acquisition, can have major effects on solvency. Liquidity reflects the amount of time required to sell an asset and the discount in sale proceeds resulting from a forced sale. Savings accounts, grain in the bin, and market livestock are highly liquid assets because they can quickly be converted to cash and their liquidation costs are low. In contrast, land is considered an illiquid asset because liquidating a tract of land on short notice generally involves a substantial discount in sales price. In times of general farm financial stress, many durable agricultural assets can be very illiquid.
Insurance is a financial response to risk which provides a specialized source of liquidity. Most farmers use various forms of insurance to protect against specific types of losses. Fire insurance provides liquidity to replace losses due to fire. Most farmers find that commercial fire insurance is more cost effective than self insurance (maintaining a reserve of funds to offset a loss). Self insurance and commercial insurance both involve costs for risk protection.
The idea of insurance is to buy protection against a loss. Expenses associated with providing commercial insurance (the insurance load factor) may vary from 10 to 50 percent or more of the premium. The premiums paid by most individuals will far exceed the amount they receive back from the insurance company.
Risks which have a low probability of occurrence and very adverse consequences are the most logical risks to insure against. Liability, major medical, disability, and fire/extended coverage on buildings, equipment, and livestock are examples of insurance which many farmers carry. Self insurance, included in the normal cost of doing business, is generally more cost effective for risks which occur frequently and cause only minor problems. Insurance to protect against hog deaths in finishing could probably be obtained, but farmers typically average out these losses as part of normal production costs.
Many other types of insurance with different levels of coverage are available. One's financial position is important in determining whether to self insure or buy commercial insurance. A farmer in a strong financial position using the car only to drive to church might logically decide not to carry collision insurance, even with a very high deductible. In contrast, another farmer in a weaker financial position whose spouse drives to work every day may logically carry collision insurance with the minimum deductible.
Multiple peril crop insurance and hail/fire insurance are examples of insurance options which depend heavily on the financial position of the farmer. Multiple peril crop insurance (MPCI) has options for coverage of 50, 65, and 75 percent levels of yield coverage. A farmer in a strong financial situation may decide to forgo purchasing MPCI, electing to self insure for possible losses. In contrast, a farmer in a weak condition may elect, or be required by the lender, to carry MPCI. Decisions on whether to carry hail insurance are influenced by similar factors, as well as producers' perceptions of the probability and extent of hail damage.
Having reserves to provide liquidity is another financial strategy for dealing with variability. Many farmers use inventory reserves as a cushion that can be drawn upon in times of adversity. Inventory reserves, like a bin of grain, would be a current asset on the farmer's balance sheet. If an unexpected event occurs, the grain can be sold and the proceeds used. Although a bin of grain is better than no reserve, stored grain does have some risks associated with it. The price could go down, reducing the value of the reserve. Stored grain earns no interest, and the grain could go out of condition. Insurance and taxes, as well as interest foregone, are other costs associated with maintaining inventory reserves.
Some farmers in the 12-state study maintained financial reserves such as bank accounts, mutual funds, stocks, bonds, and other financial assets for bad times. Most of the farmers interviewed indicate that they would like to maintain greater financial reserves. However, for many farmers in the growth and expansion phase (or perhaps even in a holding phase), major financial reserves are not feasible because any earnings are reinvested in the farm business.
Farmers should consider what returns are likely to be for both farm and nonfarm activities. Some nonfarm investments may offer high returns and diversification in investments. Furthermore, these nonfarm investments can serve as financial reserves.
Farm families do need a personal or family financial reserve if at all possible. The purpose of this reserve is to reduce stress in the family and allow the household to operate. For example, if the washing machine breaks down, a family should be able to fix it without having to consult their lender. This type of a reserve is important, but it should not be abused. Many lenders can tell stories of personal expenses making good loans go bad.
For most farmers, the size of inventory and/or actual financial reserves they can hold is small relative to their capital needs. Therefore, holding a credit reserve is a common financial response to variability. A farmer may limit borrowing to have a reserve of unborrowed funds to draw upon in response to unexpected events. In some cases, an individual may actually borrow $100,000 and only use $75,000. The ``extra'' $25,000 may be deposited in an interest bearing account. There is a cost involved in this, however, because the interest rate paid is generally greater than the interest rate received.
Some farmers have established a line of credit at a financial institution in excess of their anticipated needs. They are charged interest only on the amount actually borrowed, but can obtain the full amount if desired. Generally, this line of credit would be for operating expenses and not for capital expenditures. Most lenders will probably restrict this type of arrangement to their better borrowers, but it is a convenient arrangement for those who qualify.
Managing the pace of investments was considered the most important response to variability by the producers interviewed in the 12-state study. Pacing investments was used by almost 90 percent of the producers interviewed. Postponing capital expenditures, including replacement of durable assets, is a response to adversity. Some control over withdrawals for consumption, taxes, and other purposes is also possible, but many farm families have less flexibility than they had in the past on withdrawals from the business.
Budgeting and cash flow analysis are tools which are commonly used in helping to decide whether an investment or expenditure should be made. It is important that budgets reflect the individual producer's situation and risk costs. Budgeting typically averages out variations in prices, costs, and yields. The costs incurred if an unfavorable event occurred in the first year are commonly not included. This cost would be at least equal to the interest on the income shortfall.
Cash flow analysis based on ``the going concern'' results can be misleading if there are substantial start up costs. Beginning or expanding livestock enterprises or major changes in crop technology can involve substantial start up expenses. Budgets and cash flow analysis should also include a risk cushion, a reserve for unknown or overlooked risks.
Procedures to acquire assets are an important risk response which is closely related to managing the pace of investments. Leasing rather than purchasing assets may be another way to maintain greater liquidity in the farm business. Very commonly, farmers cash rent or share lease land, allowing greater investment in short- and intermediate-term assets. Debt commitments are avoided, and liquidity of the firm is preserved. Cash rents for land represent fixed commitments and do not adjust rapidly to changing conditions. In contrast, crop share leases are highly efficient in sharing risks of changing conditions between the farm operator and landlord. Any leasing of land involves the risk of losing control of the leased ground, a risk not present with land ownership.
Leasing of other assets is not widespread in agriculture, especially in relation to the nonfarm sector. Machinery, buildings, and equipment can be leased on a long-term basis. Traditionally, farmers have preferred to own rather than lease assets.
Enterprises can sometimes be initiated with other than turnkey operation facilities, thus improving liquidity and solvency. Experience can be gained and projects aborted with relatively little loss. For example, hog production can be started in low cost or existing facilities, with one or two litters the first year. Used machinery may be used instead of new machinery. Beginning farmers may start with less than a full line of machinery. For example, custom combining may be hired. Projected profits may be less, but this is the cost associated with the reduced risk.
Credit or loan limits influence the degree of leverage in a farm operation. Credit limits may be internal, that is, imposed by the farmer (''Never buy land unless you can put 50 percent down''). Alternatively, credit limits may be external, imposed by the lender (''The most we can go on operating expenses is $50,000 this year, and you'd better not buy that new tractor you talked about'').
Events of the last few years have shown that what were considered fairly conservative credit limits in the past can get people into trouble. Some of the factors to be considered are:
Managerial ability of the operator can make a major difference in the amount of debt which can be handled. A good manager simply has a bigger margin between returns and costs than a poor manager. This margin serves as a cushion for adversity, and the size of this cushion grows over time. (Remember that about one half of the farmers are below average in their managerial ability.)
Absolute size of the debt has some influence. An individual may feel more comfortable owing $10,000 with an equity of $1,000 than owing $1 million with an equity of $2 million. In part, this relationship exists because it may be easier to repay a small loan than a large loan if it turns out to be a bad investment. Larger loans may also be difficult for lenders. Legal and/or financial limitations may make it impossible for lenders to work with potential borrowers with very large needs. Furthermore, as the proportion of their portfolio committed to a particular borrower increases, lenders may want greater security.
Intended use of funds also affects acceptable debt levels. Some uses, like fertilizer and feed, have a high payoff and quick returns. Buildings and machinery pay off over longer periods. Land is a very long-term investment, even with favorable financial conditions. Lenders generally are more willing to loan a higher proportion of funds for uses with faster returns.
Loan arrangements, the scheduling, timing, and term of loan repayments, are also important. Startup expenses can be considerable and initial returns slow for some investments. Financing an expansion of the hog enterprise may involve a period of 18 months or more before the additional returns are realized. In cases like this, scheduling a loan payment in 12 months may cause substantial difficulties. Arranging loan payments to coincide with expected receipts reduces asset management problems. On a hog enterprise with 6 marketings per year, several payments during the year may be easier than an annual payment that requires accumulation and investment of funds throughout the year. The term of loan repayments should also be in line with economic returns expected from the investment. If machinery is giving a return over a 7-year period, financing should generally not be on a 3-year note.
Off farm employment is another financial response to risk. Many farmers and spouses have part or full time off farm jobs which increase the firm's capacity to bear risks. Some off farm activities may be agriculturally related, such as custom work, grain hauling, or seed and fertilizer sales. Other off farm activities may be entirely unrelated to agriculture. Most farm families would probably indicate that these off farm activities are to supplement income for family living, but they are a significant response to risk in many instances. For many farm families, off farm activities are the new form of diversification of enterprises.
Financial responses generally affect the firm's capacity to bear risk rather than the occurrence of unfavorable events themselves. ``Going broke'' or ``having cash flow problems'' is the consequence of one or more other risks, not a risk itself. Financial responses should be designed to reduce the adverse consequences of these other risks. Farmers in strong financial positions have flexibility in choosing their risk responses. In contrast, lenders may have considerable influence on the financial responses to risk employed by farmers using significant borrowed funds.
                Examples of Farm Business Management Responses that:
Area of the     Reduce Chances of               Provide Protection Against
Farm Business   Event's Occurrence              Event's Adverse Consequences

_______________________________________________________________________________

Production      Choosing low risk activities    Selecting and diversifying
                Diversifying enterprises          production practices
                Dispersing production           Maintaining flexibility
                geographically
_______________________________________________________________________________

Marketing       Obtaining market information    Participating in
                Spreading sales                   government programs
                Forward contracting             Options trading
                Hedging
_______________________________________________________________________________

Financial       Working off farm                Insuring against losses
                                                Maintaining reserves
                                                Pacing investments
                                                Acquiring assets
                                                Limiting credit and leverage
_______________________________________________________________________________
Risk balancing is fundamental to risk management for most farmers. If they take an action in one aspect of the business which increases risk, an offsetting action is taken to maintain the total risk at a constant level. As one producer expressed it, ``If I borrow money to buy feeders, I hedge.'' The increased risk associated with borrowing is offset by reducing the risk of output price variability. Other producers indicate that if taking one action would require an offsetting action to keep risk within acceptable limits, they do not take the first action. This is another form of risk balancing which can be equally as effective.
Because of the multiple sources of risk, comprehensive strategies that integrate several responses to variability are often necessary for effective risk management. The particular combination used by an individual farmer will depend on the individual's circumstances, type of risks faced, and risk attitudes. Table 3 summarizes the principal risk responses discussed in this publication by area of the farm operation and by their primary effect in risk management. Some risk responses act primarily to reduce the chance that an adverse event will occur, while other responses have the effect of providing protection against adverse consequences should the unfavorable event occur. Farmers find many different ways to implement these principal risk responses.
Grain and livestock producers typically use a combination of production responses in their risk management. Corn, soybeans, wheat, hogs, and dairy cattle are the major enterprises on most farms, and these are among the low risk activities. Farmers commonly combine enterprises, although diversification possibilities may be limited. Typically, farmers use production practices selected to be effective in a variety of circumstances. Dispersing production geographically, maintaining flexibility, and varying production capacity are of lesser importance to many farmers.
The marketing responses of spreading sales and forward or minimum price contracts, combined with market information, are very common for producers. Most producers also maintain their eligibility to participate in government commodity program, although their participation is likely to depend on program specifics. Use of hedging and options trading is less common, but many producers are following developments and learning about these alternatives.
The financial responses are used to increase a farm's capacity to bear production and marketing risk and to cope with financial risks as well. The adverse conditions in much of the 1980s have increased producers' awareness of financial responses. Many producers combine several, if not all, of the financial risk responses.
The risk responses available to an individual and the degree to which one can make use of a response are affected by factors outside the individual's control. For example, most farmers would like to forward contract corn for $5.00 per bushel, but the opportunity does not exist. Maintaining a $100,000 credit reserve is also not feasible for many farmers. Part of good risk management is recognizing what is feasible and effective in individual circumstances.
A comprehensive strategy integrating production, marketing and financial responses will reduce risk more effectively than will a series of separate and individual responses. Which integrated risk management strategy is best depends, again, on individual circumstances. A farmer's goals and risk attitudes, expectations about the future, equity position, resources available, financing available, market availability, and other factors affect which combination of responses is best. As these factors change, so will the best strategy.
RISK QUIZ AND INTERPRETATION
The following quiz may help measure your risk attitudes. Knowledge of your risk attitudes can be helpful in understanding your feelings in certain situations and why you may make particular decisions. There are no right or wrong answers; answer according to your own preference.
What are your attitudes toward these risky situations?
1. Imagine yourself on your way to a ballgame with a pair of tickets for which you have paid $30. After parking your car, you realize that you have lost the tickets. The box office has two tickets for sale for $30. Would you buy the tickets?
      a. yes
      b. no
2. Imagine yourself on your way to a ballgame. You intend to spend $30 for the tickets at the box office. After parking your car, you realize you have lost $30. However, you still have enough cash to purchase the tickets. Would you buy the tickets to the game?
      a. yes
      b. no
3. Imagine you are given the choice between two options. The first is a sure gain of $700. The second is a risky prospect that offers a 75 percent chance of winning $1,000 and a 25 percent chance of winning nothing. Which option would you select?
      a. a sure gain of $700
      b. a 75 percent chance of winning $1,000 and a 25 percent chance
         of winning nothing
4. Imagine you are given the choice between two options. The first is a sure loss of $700. The second is a risky prospect that offers a 75 percent chance of losing $1,000 and a 25 percent chance of losing nothing. Which option would you select?
      a. a sure loss of $700
      b. a 75 percent chance of losing $1,000 and a 25 percent chance
         of losing nothing
5. Imagine the U.S. preparing for the outbreak of a rare Asian disease which is expected to kill 600 people. Two alternative programs to combat the disease have been proposed. If the first program is adopted, estimates are that 375 people will die. If the second program is adopted, there is a 1/3 probability that nobody will die and a 2/3 probability that 600 people will die. Which program would you select?
      a. a sure loss of 375 lives
      b. a 1/3 probability of nobody dying and a 2/3 probability of
         600 people dying
6. Imagine you have been offered a choice between (a) winning a sure cash prize and (b) a risky option with a 50 percent chance of winning $100 and a 50 percent chance of winning nothing. How big would the sure cash prize have to be to make the prize just as attractive as the risky option for you?
      a. $30     e. $50
      b. $35     f. $55
      c. $40     g. $60
      d. $45     h. $65
7. Consider a situation in which you face a 50 percent chance of losing $100 and a 50 percent chance of winning a cash prize. What is the smallest cash prize that would make this risky option acceptable to you?
      a. $50     e. $150
      b. $75     f. $175
      c. $100    g. $200 or more
      d. $125
8. How many lottery tickets do you buy each week, on the average?
      a. none
      b. one
      c. two
      d. three or more
9. Imagine you are about to buy a tie for $10. The salesman tells you that the tie you want to buy is on sale for $5 at the other branch of the store. It would cost you 20 minutes of effort to buy the tie at the other store. Would you make the trip to the other store?
      a. yes
      b. no
10. Imagine you are about to purchase a new car. The dealer offers to sell you the car for $13,505 without a radio and $13,595 with the radio you want. You can go to a stereo shop and have the desired radio installed for $75, but it will require an hour of your effort. Which would you do?
      a. Buy the car equipped with the desired radio for $13,595
      b. Buy the car without a radio for $13,505 and have the desired
         radio installed at a stereo shop for $75
11. Paul has an investment in money market funds. During the past year, he could have invested this money in the stock market, and he would have been $25,000 ahead. Unfortunately, Paul retained his money market funds. Dave had an investment in the stock market. But last year he sold all his shares and invested in money market funds. His investment is now worth $25,000 less than it would have been if the stock had been retained. Who feels worse?
      a. Paul
      b. Dave
The responses to these questions tell us quite a lot about how people think and react in situations involving risk.
Most people answer ``no'' to the first question and ``yes'' to the second. Individuals tend to be Calculators and establish mental accounts. In the first question, you have already paid $30 for the lost tickets and you are considering spending an additional $30 for tickets. In the second question, you lost some money and the tickets only cost $30. In either case, if you go to the ballgame, it will cost the equivalent of $60, but it seems less to many people in the second case. (This may be related to ``saving'' $50 when you buy a $149 jacket on sale for $99).
Most people opt for answer ``a'' in Question 3, the sure gain. Although answer ``b'' provides a higher average, or expected, value if done repeatedly, most individuals are risk averse (opposed to risk) with respect to gains. Most people are Calculators in that they prefer a smaller gain that is certain to a larger gain that is uncertain.
Farmers are also generally risk averse with respect to gains. Many farmers diversify their production, preferring the lower, more stable income to the higher, more variable income associated with specialization. Many farmers also routinely use herbicides, insecticides, and antibiotics as insurance to avoid the possibility of a major loss.
Most people pick answer ``b'' for both 4 and 5. Again, if done repeatedly, the ``b'' answers have higher average, or expected, loss values ($750 loss in question 4 and a loss of 400 lives in question 5) than the ``a'' answers. Most people are risk seeking, somewhat like Daredevils, when it comes to losses. We prefer to take a chance (hoping that we lose nothing or that nobody dies) rather than accept a smaller sure loss.
Many farmers follow this principle in their marketing. They hesitate to lock in a sure loss by forward contracting for a price below their cost of production. They prefer to gamble that prices might increase. In many instances, the gamble will result in even larger losses than those associated with the forward contracting strategy.
Most people answer ``a,'' ``b,'' ``c,'' or ``d'' ($45 or less). The lower the amount of money you need for the sure thing, the more risk averse you are. If you answered ``e,'' $50, that is the expected value of the prize and indicates neutrality with respect to risk. Answers ``f,'' ``g,'' and ``h'' ($55 to $65) indicate you are willing to pay for the opportunity to win an expected value of $50. Adventurers and Daredevils would probably come in this category. Slot machines, roulette, and shooting craps are examples in which the expected return, the average outcome of repeated tries, is less than the cost of playing. An individual pays for the privilege of gambling.
Farmers differ in their degree of risk aversion. Some farmers, like Avoiders, follow more conservative, risk reducing strategies than others. The lower the amount of money needed for you to accept the sure thing, the more you would probably avoid risks in your farm decision making.
Most people will answer more than $100, choosing answer ``d'' and beyond. For most people, the pain of losing a sum of money is more intense than the pleasure of winning the same sum. Most people act somewhat like Avoiders, only taking a risky option at even odds when the possible gain is substantially larger than the possible loss.
An individual who takes a speculative position in the market and loses $10,000 will typically feel the loss more intensely than the pleasure associated with a gain of the same amount.
Lotteries are a form of tax. Payoffs to individuals are considerably less than the income to the state and should be of interest only to Daredevils. However, many people will buy one or more lottery tickets a week. This illustrates that the low probability of an occurrence (your chance of winning) is commonly overweighted by Calculators in decision making. Other individuals, perhaps even Avoiders, may look at buying lottery tickets as a form of entertainment.
Most people answer question 9, with ``a'' and question 10 with ``b,'' indicating that one's frame of reference is important. In question 9, you can save 50 percent, $5, for 20 minutes effort. In question 10, the extra $15 it costs to get the desired radio from the dealer is very small relative to the cost of the car. However, the Calculator will note that the savings by having the radio installed at the stereo shop, $15 for one hour's effort, is the same return for your time as buying the tie at half price.
Individuals differ in their ability to handle risky situations involving large sums of money. Experience can also be important. Making a decision the first time may involve restless nights, agony over the decision, and worry about the outcome. The next time, the decision is easier to make. A farmer's decisions have generally grown over time as responsibility and size of the farm increased. Gradual expansion of a farmer's frame of reference makes risky decisions easier.
Who feels worse, Paul or Dave? Most people answer ``Dave.'' For most people, the regret associated with a loss from taking an action is greater than that from inaction.
This principle helps to explain some farmers' marketing behavior. Many farmers regret the loss associated with selling corn at $2.50 and seeing the market go to $3.00 more than they regret not selling at $2.50 and the market going to $2.00. People, regardless of their risk type, tend to be more critical of their decisions to act than their decisions to be passive or to do nothing.
As indicated before, there are no ``right'' or ``wrong'' answers to these questions. The typical answers help explain the attitudes of many people toward risky situations. Gains and losses do tend to be viewed differently by individuals. The particular context in which a risky choice is presented can also be important. If your answers were generally the same as the typical answers, it suggests that your risk attitudes are like those of many other people. If your answers were different, it suggests that your attitude toward risk may also be different. These differences in our risk attitudes help explain why people in similar situations reach different decisions.
ELEMENTS OF DECISION MAKING UNDER RISK
Decision making under risk involves probabilities, measures of variability, expected values, and expectations. Many farmers utilize these concepts, often without recognizing them. The following sections are designed to help farmers recognize and understand these elements of their decision making.
Probabilities are simply a way of expressing the chances of various outcomes. Weather forecasts use probabilities. For example, they may indicate a 20 percent chance of rain or a 40 percent chance of snow. At the start of a football game, a coin is flipped. What are the chances or probabilities that it will come up ``heads''? Fifty percent or one half. The chances for ``tails'' are exactly the same.
We flip a coin, and it comes up heads. If we flip it again, what is the probability that it will come up heads a second time? Assuming it is a fair coin, the probability is still one half. Each flip of a coin is independent of the previous flips.
If we have had 5 heads in a row, what is the probability of getting a sixth head? It is still one half! Over a repeated number of flips of a coin the number of heads and tails will tend to even out. The ``gambler's fallacy'' sometimes leads people to think that after 5 heads in a row tails is ``due,'' but the probability of heads on any given flip is one half. Weather this year is largely independent of weather last year. However, because of production cycles in hog and beef production, prices in different years cannot be considered as independent.
If we flip a coin twice, which is the more likely sequence: heads (H) and then tails (T), H-T, or two heads, H-H? We know that if we flip a coin twice there are four possible outcomes:
H - H
H - T
T - H
T - T
All are equally likely! There is a 25 percent chance of any one specific sequence occurring. However, a head and a tail without considering the order of the outcomes is twice as likely as two heads or two tails.
If we consider 3 flips, things become a little more complicated. There are a total of eight possible sequences. They are:
H - H - H
H - H - T
H - T - H
T - H - H
T - T - H
T - H - T
H - T - T
T - T - T
Again, the probability of any given sequence of outcomes is the same (1 in 8 or 12.5 percent). The probability of 3 heads is the same as the sequence heads, tails, and then heads. However, there are 3 ways to have 2 heads and a tail. If the frequency of the outcomes or number of times a result occurs is plotted as in Figure 1, the frequency humps up in the middle. The frequency of getting a combination of heads and tails is much more likely than getting strictly heads or strictly tails. Thus, a combination of good and bad years weatherwise is more likely than a run of good or bad years.

Now let's consider tossing a die. With six sides, there are 6 possible outcomes, and all are equally likely. If we combine two, six-sided dice, the possible outcomes in terms of the total number of spots showing are as follows:
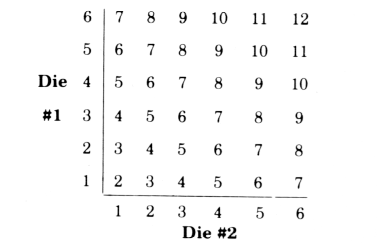
These possible outcomes can also be expressed in graphic form (Figure 2) as the number of chances of occurrence in 36. Getting a 7 is the most likely outcome (6 in 36). ``Snake eyes'' (double ones) are uncommon (1 in 36), as are double sixes. The probability of an outcome of four or less (a pessimistic outcome) is six of thirty six or one sixth. Likewise, the probability of a ten or more (an optimistic outcome) is one sixth. Two thirds of the time the outcome will be a 5, 6, 7, 8, or 9.

The normal bell shaped curve distribution (Figure 3) is closely related to the outcomes of tossing two dice, with the most common outcome being the average or mean value. Two thirds of the time, the outcome will be in the 5 through 9 range. One sixth of the time the outcome will be 4 or less. On the other side, one sixth of the time the outcome will be 10 or more. These less frequent outcomes may be considered ``optimistic'' or ``pessimistic'' depending on whether they are good or bad.

Crop yields and annual average prices received by farmers, as well as many other economic outcomes, occur much like the normal curve distribution. The average value tends to be the most frequent outcome, and the pessimistic and optimistic values are much less frequent. Whether outcomes exactly follow the normal curve is relatively unimportant. In decision making, we need to remember that yields or prices which are near the average are much more frequent (more likely) than either very high or very low prices or yields.
Variability of outcomes is generally associated with risk, and typically riskier situations have greater variability of outcomes. The average outcome is the most frequent or most likely if outcomes are normally distributed, but the average does not provide information about variability. The range-the highest and lowest values-combined with the average does provide some information about variability. However, it is difficult to make comparisons of variability between crops or prices.
The coefficient of variation is a statistical measure of variability based on all of the values for yields or prices, not just the high, low, and average. Many baseball fans do not know how to compute a pitcher's earned run average, but they use earned run averages to make comparisons among pitchers. In a similar way, these coefficients of variation can be used to make comparisons of variability among crop yields or prices. The lower the coefficient of variation, the lower the variability.
For example, assume corn yields averaged 110 bushels per acre with a coefficient of variation of 15.0 percent. For soybeans, yields average 35 bushels per acre with a coefficient of variation of 10.0 percent. In this example, soybean yields are relatively less variable from year to year than corn, as indicated by the smaller coefficient of variation. Furthermore, if yields are distributed like the normal curve, two thirds of the time soybean yields would be expected to fall within plus or minus 10 percent of 35 bushels. Two thirds of the time soybean yields would be expected to be in the 31.5 to 38.5 bushels per acre range. In contrast, for corn, the range is plus or minus 15 percent or from 93.5 to 126.5 bushels per acre. About one sixth of the time yields would be below these lower levels and about one sixth of the time above. Thus, optimistic outcomes, corn yields of over 126.5 bushels per acre or 38.5 bushels of soybeans per acre or more, would be expected one year in six. Pessimistic outcomes, yields below 31.5 and 93.5 bushels per acre for soybeans and corn, would also be expected to occur one year in six.
Sometimes, as in the risk attitude quiz in Appendix A, choices must be made among risky alternatives. Other times, comparisons must be made between a return which is certain (like the interest rate on a certificate of deposit) and one which is risky (like growing corn). Many people make these comparisons every day without recognizing the formal framework involved. The expected value is a mathematically derived value which weights the outcomes by their respective probabilities. Computing the expected value is a means of assigning a value to a risky alternative.
What is the expected value of a ticket in a raffle with 10,000 tickets and a prize worth $25,000? Because 9,999 tickets do not win the prize and only one does, we can compute the expected value of a ticket as:
     $0   x   .9999     =         0
$25,000   x   .0001     =      2.50
                             -------
                              $2.50
In this case, the number of tickets and the prize are both known with certainty. Whether an individual buys a raffle ticket with an expected value of $2.50 for $2.50 depends on one's attitude toward risk in this situation. A risk averse individual would not buy the ticket, but a risk preferrer would be willing to pay more than $2.50. (Even a risk avoider may buy a raffle ticket with an expected value of $2.50 for $5.00 if sold by a charitable organization, but risk concerns are unimportant in this situation.)
In other situations, the probabilities and/or the outcomes may not be known with certainty. In this case, individuals typically use their expectations about the future to determine expected values. For example, assume that enterprise ``A'' is ``most likely'' to give a net return of $50 per acre. An ``optimistic'' estimate of net returns is $150, and a ``pessimistic'' estimate is a loss of $100 per acre. If the optimistic and pessimistic outcomes each occur one year in six, the expected value of enterprise A can be computed as:
$150   x   1/6      =      $25.00
  50   x   4/6      =       33.33
-100   x   1/6      =      -16.67
                          --------
                            41.66
Note that the probabilities 1/6, 4/6, and 1/6 sum to one. All of the outcomes which could occur have been accounted for in estimating the expected value.
An alternative enterprise, ``B,'' may have a ``most likely'' net return of $40 per acre. The ``optimistic'' and ``pessimistic'' estimates of net returns are $90 and $20 per acre respectively. Assuming the same probabilities of outcomes for enterprises A and B, the expected value of enterprise B can be calculated as:
$90   x   1/6      =      $15.00
 40   x   4/6      =       26.67
  0   x   1/6      =       -3.33
                          -------
                          $45.00
In these examples, the expected value of enterprise B is greater than that of enterprise A. Although the estimates of the most likely and optimistic estimates of returns for enterprise A are higher than for enterprise B, this is more than offset by the differences in the pessimistic returns. In this situation, with other things being equal, most decision makers would prefer enterprise B.
The expected value of an alternative is affected by estimates of both probabilities and net returns. The two calculations below indicate different assumptions for enterprise A. In the first, it is assumed that the optimistic returns will occur 2 years in 6 and the most likely 3 years in 6. In the second, it is assumed that the most likely return is $75 instead of $50 with the same probabilities as in the original example. The expected values are:
Calculation l          Calculation 2
$150 x 2/6 = $50.00    $150 x 1/6 = $25.00
  50 x 3/6 =  25.00      75 x 4/6 =  50.00
-100 x 1/6 = -16.67    -100 x 1/6 = -16.67
             ------                 ------
             $58.33                 $58.33
             ------                 ------
The expected values in both calculations are exactly the same and are higher than the expected value for enterprise B.
Although computing an expected value of an alternative is a mathematically precise procedure, individuals may have different expected values for the same alternative. This occurs because people differ in their assessments of both the outcomes which may occur and the probabilities with which they may occur. Very few individuals will routinely compute the mathematically expected value, but the concept is useful in decision making because both the range and probability of possible outcomes are considered.
Footnotes:
** George F. Patrick, ``Producers' Attitudes, Perceptions and Management Responses to Variability,'' Risk Analysis for Agricultural Production Firms: Concepts, Information Requirements and Policy Issues, Department of Agricultural Economics, University of Illinois, AE-4574, July 1984, pp. 197-236, and George F. Patrick et al., ``Risk Perceptions and Management Responses: Producer-Generated Hypotheses for Risk Modeling,'' Southern Journal of Agricultural Economics, Vol. 17, No. 2, December 1985, p. 231-238.
*** Adapted from D. Lynn Forster, Ohio State University, ``Interfacing Farm Finance and Marketing,'' Workshop for Extension Specialists on Marketing, Risk and Financial Management, Minneapolis, April 2-3, 1984.
**** This section draws on Kim B. Anderson and John E. Ikerd, ``Risk Rated Management Strategies for Farm and Ranch Decisions,'' Extension Circular E-841, Oklahoma State University Cooperative Extension Service.
North Central Region Extension Publications are subject to peer review and prepared as a part of the 13 land-grant universities of the 12 North Central States, in conjunction with the Extension ServiceU.S. Department of Agriculture, Washington, D.C. The following states cooperated in making this publication available.
*Indiana                             Missouri
Media Distribution Center            Extension Publications
301 S. Second Street                 115 S. Fifth St.
Purdue University                    University of Missouri
Lafayette, IN 47901-1232             Columbia, MO 65211
(317) 494-6795                       (314) 882-2792

Iowa                                 North Dakota
Publications Distribution            Ag. Communications
Printing & Pub. Bldg.                Box 5655, Morrill Hall
Iowa State University                North Dakota State University
Ames, IA 50011                       Fargo, ND 58105
(515) 294-5247                       (701) 237-7881

Kansas                               Ohio
Distribution Center                  Publications Office
Umberger Hall                        Ohio State University
Kansas State University              385 Kottman Hall
Manhattan, KS 66506                  2021 Coffey Rd.
(913) 532-5830                       Columbus, OH 43210
                                     (614) 292-1607
Michigan
Bulletin Office                      South Dakota
10B Ag. Hall                         Ag. Comm. Center
Michigan State University            Box 2231
East Lansing, MI 48824-1039          South Dakota State University
(515) 355-0240                       Brookings, SD 57007
                                     (605) 688-5628
Minnesota
Distribution Center                  *Publishing state
3 Coffey Hall
1420 Eckles Ave.
University of Minnesota
St. Paul, MN 55108
(612) 625-8173
New 5/92
For copies of this and other NCR Extension Publications, contact one of the institutions listed above.
Appreciation is expressed to John A. Anderson, Ontario Ministry of Agriculture and Food; J. Roy Black and Ralph E. Hepp, Michigan State University; William Edwards, Iowa State University; Jim Polson, Ohio State University; Richard L. Trimble, University of Kentucky; and Dave Bache, Freddie Barnard, and Don Pershing, Purdue University, for comments helping to clarify earlier versions.
The programs and activities of state Cooperative Extension Services are available to all potential clientele without regard to race, color, sex, religion, national origin, age, or handicap.
In cooperation with NCR Educational Materials Project Issued in furtherance of Cooperative Extension work, Acts of Congress of May 8 and June 30, 1914, in cooperative with the U.S. Department of Agriculture and Cooperative Extension Services of Illinois, Indiana, Iowa, Kansas, Michigan, Minnesota, Missouri, Nebraska, North Dakota, Ohio, South Dakota, and Wisconsin. H. A. Wadsworth, Director,