AY-210
Many combinations of tillage methods are available for corn and soybean production. Currently much of the primary tillage is done in the fall. Deep tillage with the moldboard plow is still common, but fall chisel plowing for corn or soybeans is widely used. Other forms of conservation tillage are being adopted for cost savings and to control erosion.
There are still questions about which system is best. This bulletin describes a technique that can be used to select a suitable system for a field with several soil types. The results of years of research and farmer experience suggest that no one system is best in all situations but principles can be used to select an appropriate system on a given landscape.
There was a great decrease in the use of forage crops in rotations and a great increase in fall moldboard plowing over large portions of Indiana from 1955 to 1970. Farmers liked to fall moldboard plow the nearly level, slow draining soils because a more satisfactory seedbed was obtained compared to spring plowing. This also allowed for earlier spring planting. However, many farmers also fall-plowed sloping, well drained. erodible soils, which gain no benefit from fall tillage and are vulnerable to erosion until the crop canopy closes the next summer.
Erosion, as a result of fall plowing, increased as more acres of row crops were grown. Conservation tillage (a system that leaves at least 30% surface residue cover after planting) offers an effective alternative that reduces erosion. The selection of the most appropriate system to use is a critical first step. Fortunately, some form of conservation tillage is suitable for nearly all of Indiana's cropland. The information provided in this publication should allow Indiana farmers to choose a tillage system for a particular field that will maximize production while controlling soil erosion and protecting water quality.
Results of Indiana tillage studies over the last 20 years show that tillage effects are influenced strongly by three factors: 1) sequence of crops grown, 2) natural soil drainage and adequacy of installed field drainage. and 3) climate or latitude as it affects spring warm up and summer drought. Understanding these influences should provide a basis for making better tillage decisions and matching a given system to a particular soil condition.
Across Indiana, corn yields increase when corn follows any other crop. This has been true for a range of soils of varying drainage classes, even when fertilized and managed to produce maximum economic yields. Corn may yield five to 10% higher following soybeans and as much as 15% higher following sod when compared to continuous corn yield. Soybean yields also improve by 5-10% when rotated with corn. For both crops the negative effect from continuous cropping appears to be greater for no-till planting than for other tillage systems.
Higher yields in rotation may be partly due to decreased potential for serious disease and insect infestations associated with crop residues. Also, toxins from decaying residues may reduce germination and slow early growth, resulting in lower yields, when the same crop is grown in succeeding years. Weed control may also improve because herbicides are rotated along with the crops, controlling a broader spectrum of weeds.
The effects of drainage have been demonstrated for Indiana soils in numerous comparisons of conservation tillage systems with moldboard plow systems for both continuous corn and corn in rotation with soybeans.
The poorly drained soils with corn residue cover warm more quickly following fall moldboard plow tillage than with conservation tillage systems. This often results in a yield advantage for moldboard plow systems on poorly drained soils. With soybean residue at the surface, or an elevated row area with ridge-till, there is less difference between conventional and conservation tillage systems.
Spring soil warm-up differences among tillage systems are much less on well drained soils. Yields for conservation tillage systems are often higher than yields with moldboard plowing on well drained soils, most likely due to moisture conservation and improved soil physical properties with conservation tillage.
The average time required for soils to warm in the spring is related to north-south location in Indiana. Similarly, the dates of last freezing temperatures in spring, length of growing season, and total rainfall and its distribution also vary by location.
Southwestern Indiana has a Growing Degree Day potential of 2700 for corn to mature compared to 2400 Growing Degree Days for northeastern Indiana. Normal rainfall in southern Indiana is higher (40-45 in. per year) than in northern Indiana (35-40 in. per year) Soils in southern Indiana warm earlier and are adapted to a wider choice of tillage than soils of central and northern Indiana However, wetness due to high winter rainfall and slow drying on some southern Indiana soils may delay planting until the season is well underway in central and northern Indiana.
Soil temperature variation with location has been studied for corn and soybeans in rotation and for continuous corn on tillage plots comparing moldboard, chisel, ridge and no-till planting. No-till and, to a lesser extent, chisel and ridge systems with large amounts of surface residues, had cooler temperatures on all soils. However, soil temperatures the first four weeks after planting are higher with no-till in southern Indiana than with a moldboard plow system in northern Indiana. Soil temperatures in ridges were nearly equal to those with plowing in northern Indiana.
The more rapid soil warming in the South favors conservation tillage, and the greater mulch cover provides crop moisture during midsummer droughts. No-till is also appropriate for sloping, well drained lands in central and northern Indiana for the same reasons.

This section discusses the characteristics of the various tillage systems rated in this bulletin.
As used in this bulletin moldboard plowing either in the fall or spring refers to use of a moldboard plow at a depth of 6-10 in. to invert the topsoil and bury the crop residue. This is followed by one to three passes with a disc harrow, field cultivator or power harrow for secondary tillage.
After moldboard plowing and secondary tillage, there is little crop residue left after planting. This system allows maximum flexibility for incorporating fertilizers and pesticides, and provides a residue-free surface for herbicide-soil contact and a chance to cultivate early if needed.
Soils with low organic matter content often slake rapidly from heavy spring rains, filling voids and reducing infiltration of water. As the soils dry, crusts may form which delay seedling emergence. On slopes, runoff and erosion potential is greatest after moldboard plowing.
Soil compaction is more likely with moldboard plow systems which usually include two or more secondary tillage trips. This secondary tillage increases the chance of harmful compaction in the spring.
As used in this bulletin chisel plowing either in the fall or spring refers to the use of a chisel plow to a depth of 6 to 12 in. The spacing and shape of the shanks as well as the type of point used could vary considerably but these factors were not considered in the evaluation of the system. Chisel plowing, followed by discing and/or field cultivation, furnishes most of the advantages of moldboard plow tillage with fewer of the disadvantages.
Chisel plowing usually leaves soil surfaces looser, more cloddy and with 30-60% overwinter cover after corn but with little surface cover after soybeans. The twisted shank incorporates more residue than the straight shank. Following corn, chisel plowing can also leave 20% or more cover after planting if a field cultivator is used for final fitting. The residue lessens rainfall impact on bare surfaces and decreases runoff and erosion. Contour chisel plowing on slopes is particularly effective in controlling erosion.
Surface-applied fertilizers are effectively incorporated to a depth of only 3-4 in. with the chisel plow. However, this usually does not cause nutrient uptake problems. Crop residues are concentrated in the upper 3-4 in. resulting in higher organic matter levels near the surface. After several years, this can improve stability of the surface granules and clods against slaking under spring rains.


As used in this bulletin, deep disc harrowing (6 in. or more) refers to primary tillage with large diameter blades. The amount of residue left on the surface is similar to that left after chisel plowing. Like chisel plowing there is considerable variation in the amount of surface residue remaining due to the blade size and spacing, weight of the implement and angle of the disc gang, as well as soil conditions. Continuous use of the disc harrow at the same depth year after year may result in the formation of a tillage pan that restricts rooting and water movement.
For purposes of this bulletin deep disc harrowing is considered to be similar to chisel plowing in its effects on crop production and erosion so the chisel plow ratings also apply to deep disc harrowing.
Shallow disc harrowing (less than 6 in.) performed either fall and spring or spring only refers to tillage by disc harrows with intermediate or smaller size blades, less space between blades, reduced gang angle or some combination of these factors. Deeper tillage with a plow or chisel is not part of this system.
Shallow discing reduces horsepower requirements and allows earlier tillage in wet soil conditions than deep-tillage systems. The amount of surface residue after planting will normally range from 30-60% after corn, but is usually less than 20% after soybeans. The principal disadvantage of shallow discing is the tendency to form a pan at the depth of tillage if this system is used continuously.
For purposes of this bulletin, the effects of shallow tillage with a field cultivator following soybeans is considered the same as shallow tillage with a disc harrow. No separation was made between field cultivators with sweeps or more narrow points.
As used in this bulletin, ridge-till is a system that uses no spring tillage prior to planting. Ridges are made with a specially designed cultivator the previous year at the final cultivation in either corn or soybeans. At planting, 1-2 in. of the ridge top is removed, and seed is planted on the ridge into firm moist soil. Crop residues are pushed to the row middles. Approximately one-third of the soil surface is cleared at planting with sweeps, vertical discs or a flat disc. A small ridge usually remains after planting. Weed control is accomplished with a combination of herbicides and cultivation. Generally, only one cultivation/ridging operation is used if herbicides are broadcast. If herbicides are banded over the row, two cultivations are needed making ridges on the second pass. Wheel tracks are confined to between-row areas. Rows and ridges are in the same place each year.
Residue cover after planting will normally range from 30-50% after corn, but is usually less than 20% after soybeans. Ridge-till should be on the contour if slopes are greater than 6% following corn or 3% following soybeans. Ridge-till has produced good stands and growth and adequate weed control on a wide range of Indiana soils.
No-till as used in this bulletin refers to placing seeds in a slot or narrow tilled strip (2 in. or less). After corn or sod, the system leaves 70-95% surface cover which is very effective in controlling soil erosion. After soybeans, no-till planting usually leaves surface cover of 50-70%.
The ultimate in reduced tillage, a no-till system may be the most effective conservation practice available to Indiana farmers. Its use, where adapted, can greatly improve on-farm conservation of soil and water.
Conservation tillage can provide good soil and water conservation, while maintaining or improving yield potential if properly adapted to the soil.
Ridge-till appears to be adapted across a wide range of soils, with excellent performance on dark, poorly drained soils which respond to artificial drainage. It also offers good erosion control potential on soils with less than 6% slope.
No-till is a good choice in southern Indiana where soils warm early, the growing season is long and summer drought is common. It is also well adapted on well drained soils of central and northern Indiana even when planting into heavy corn stalk residues. On the dark poorly drained soils of the state, no-till is often not competitive when planting into heavy residues, but does work well on these soils when planting into the lighter soybean residue. No-till is best adapted on soils that are sloping enough to dry readily in Spring or have limited moisture supplies or on poorly structured soils with low organic matter.
Each tillage system has characteristics that make it ideal for some soils and crop sequences and unsuited to others. Selecting the best adapted tillage systems can be one of the most important decisions a manager can make. For many years and in several locations, agronomists and farmers in the eastern Corn Belt have studied some commonly used tillage systems on a variety of soil types. The material presented here is based on this research and experience. It is intended as a guide for selecting tillage-planting systems that would be well adapted to the pattern of soils on a given field or farm.
Table 1 lists alphabetically all Indiana soil series and assigns them to 32 "tillage-management soil groups" based on similarities in natural drainage, landscape position, surface and subsoil character, and slope. Table 2 (for corn or soybeans after corn) and Table 3 (for corn after soybeans) rate eight common tillage-planting systems for adaptability to soils in these tillage-management groups. The two tables, together with a field-by-field inventory of the soils taken from the county soil survey, provide the information needed to determine tillage-planting system adaptability for any cropland area.
In Tables 2 and 3 the major soil drainage groups are arranged in order of natural drainage. from poorest- to best-drained. The subgroups of each major drainage group are generally in order of decreasing clay content and increasing permeability For example, the soils in subgroup IV-A are less permeable than those in IV-D.
Tables 2 and 3 present ratings of eight tillage-planting systems as to their adaptability (potential "success") on different types of soils. Each rating score is a measure of the yield potential and erosion potential of a tillage system for soils in a particular tillage-management soil group. Thus, a poor rating might be due to high erosion potential or low yield potential, compared to other systems. Production costs and pest control problems were not considered in making the ratings.
The rating scores of 1 to 5 are defined as follows:
Ratings assume a "normal" planting date for a given area. Systems leaving significant surface residue may have a more favorable rating with late planting, but a less favorable rating with early planting. In some cases, the ratings assigned are contingent on using certain Supporting practices. These situations are noted as footnotes in the tables.
1. Locate the area that you want to evaluate on the county soil survey.
2. List the soil series names of the soil mapping unit included in the area, the slope and the approximate acreage of each. Be sure to note any soils that are frequently flooded.
3. Determine for each soil series the tillage-management soil group from Table 1 and list it next to the acreage. If the soil slope is greater than 12% then no specific tillage recommendations are made for row crops In the case of soil slopes of 12-18%, row crops can be grown but only in sod based rotations. More specific information about slope length and topsoil texture is needed. Usually, no-till will be a suitable practice in the rotation on these steep slopes. Soil with slopes over 18% are in tillage management Soil Group IXA.
4. If the field has corn residue, use Table 2 to get the tillage system ratings if the field has soybean residue, use Table 3 to get the ratings. Be sure to account for the floodplain soils with a frequent flooding hazard because it changes the tillage management group and ratings.
In the appropriate table, locate the tillage-management group for each soil series identified in Step 3. Then record the ratings (from 1 through 5) for fall plowing, spring plowing, fall chisel, spring chisel, fall disc harrow, spring disc harrow, ridge-till, and no-till for each soil series.
6. Compare the ratings for each tillage system, and select the system or systems that represent the best compromise for the set of soils in the landscape.
Table 4 gives an example of how tillage-planting system ratings would be determined for three fields on a given farm. The circled ratings represent the best options. Final selection, of course, depends on conditions and equipment availability.
In using these tillage-planting system adaptability tables, keep in mind that the ratings represent generalized, rather than specific situations and are based only on soil and general crop growth considerations. Local conditions require local interpretations, because other factors besides soil adaptability are involved in choosing a tillage-planting system. Such factors include pest control problems, equipment already on hand, and the farmer's attitudes and abilities. Therefore the ratings should be used only as a guide for decision-making.
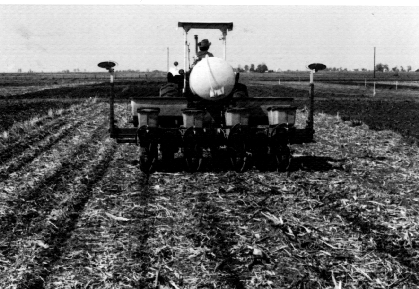
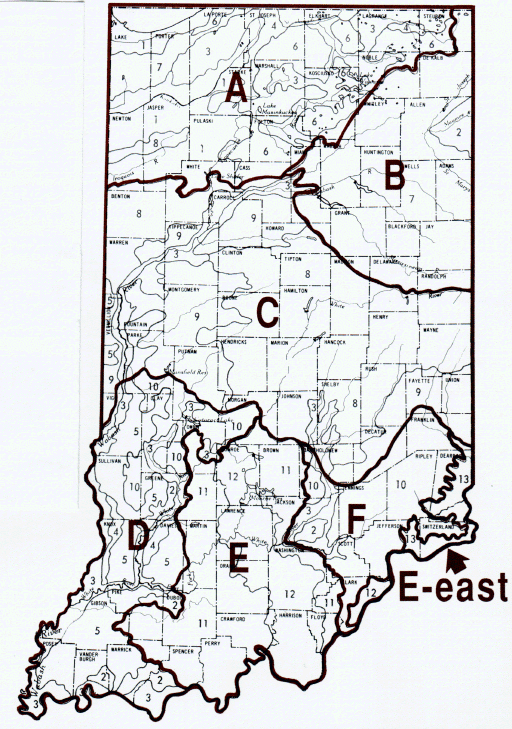
Figure 1 shows the location of six soil resource areas in Indiana. Each soil resource area contains a variety of soils with various drainage and particle size characteristics but these soils occur on landscapes in a reasonably predictable manner.
Table 5 contains estimates of the acreages and percentage amounts of the various soils in the 32 tillage management soil groups. This demonstrates some of the characteristics of each soil resource area and how it differs from the others.
Table 5 shows that Soil Resource Area A contains more sandy soils, of all different drainage conditions, and organic soils than the other areas. Soil Resource Area B contains soils with higher clay content than other soil resource areas. Soil Resource Area C contains soils that are mostly poorly and somewhat poorly drained and lower in clay content than soils of Soil Resource Area B. Soil Resource Area D contains considerable rolling land associated with the floodplain and terrace of the Wabash River as well as the wind-blown soils of the adjacent uplands. Soil Resource Area E is the part of Indiana that was not glaciated. It has a high percentage of well drained soils and a significant percentage of soils that are too sloping to be considered cropland. Soil Resource Area F has a high percentage of soils with a dense fragipan in the soil profile.
Each soil resource area has a different set of tillage recommendations based on the soil properties. The most suitable for each area can be developed from the tillage management soil groups of the dominant soils.
One factor that is not accounted for in Table 5 is current land use. Some of these lands, particularly in southern Indiana, will be in forest and some areas are in urban and suburban use. These factors were not considered but the general trends shown by Table 5 are still valid.
                Tillage                         Tillage                        Tillage
                Mgmt.                           Mgmt.                          Mgmt.
Soil Series     Group          Soil Series      Group         Soil Series      Group
------------------------------------------------------------------------------------------------
ABSCOTA         *VIII-C        CASCO            V-C           GENESEE          *VIII-B
ACKERMAN        I-A            CELINA           IV-B          GESSIE           *VIII-B
ADE             V-D            CELINA fsl       IV-D          GILBOA           III-B
ADRIAN          I-A            CERESCO          *VII-B        GILFORD          I-D
ALFORD          IV-C           CHAGRIN          *VIII-B       GILPIN           **IX-A
ALGANSEE        *VII-C         CHALMERS         I-C           GINAT            II-A
ALGIERS         *VII-B         CHATTERTON       *VIII-C       GLENHALL        V-A
ALIDA           III-B          CHEEKTOWAGA      I-E           GLYNWOOD         IV-B
ALIDA fsl,lfs   III-C          CHELSEA          V-E           GOSPORT          IX-A
ALLISON         *VIII-B        CHETWYND         IX-A          GRANBY           I-E
ALVIN           V-D            CINCINNATI       IV-A          GRAVELTON        *VI-C
AMBRAW          *VI-B          CLERMONT         II-A          GRAYFORD         IV-C
ANDRES          III-B          COBBSFORK        II-A          GRISWOLD         IV-C
APTAKISIC       III-B          COESSE           I-B           GROVECITY        III-C
ARMIESBURG      *VIII-B        COHOCTAH         *VI-B         GUDGEL           *V-A
ASHKUM          I-B            COLOMA           V-F           HAGERSTOWN       **IX-A
ATKINS          *VI-B          COLYER           IX-A          HANEY            V-A
AUBBEENAUBBEE   III-C          COMFREY          *VI-B         HANNA            V-C
AVA             IV-A           CONOTTON         V-C           HARPSTER         I-C
AVONBURG        II-A           CONOVER          III-B         HASKINS          III-B
AYR             IV-D           CONRAD           I-E           HAUBSTADT        IV-A
AYRMOUNT        IV-D           COOLVILLE        **IX-A        HAYMOND          *VIII-B
AYRSHlRE        III-C          COPE             I-C           HENNEPIN         IX-A
BANLIC          II-A           CORWIN           IV-C          HENSHAW          III-B
BARCE           IV-C           CORWIN fsl       IV-D          HICKORY          **IX-A
BARRY           I-C            CORY             III-B         HIGH GAP         IV-C
BARTLE          II-A           CORYDON          **IX-A        HILLSDALE        IV-D
BATTLEGROUND    *VIII-B        COUPEE           V-A           HOLTON           *VII-B
BAXTER          **IX-A         CRAIGMILE        *VI-B         HOMER            III-B
BEANBLOSSOM     *VIII-B        CRANE            III-B         HOMER sl         III-C
BEASLEY         IX-A           CRAWLEYVILLE     III-B         HONONEGAH        V-E
BEAUCOUP        *VI-B          CRIDER           IV-C          HOOPESTON        III-D
BECKVILLE       *VIII-B        CROSBY           III-A         HOOSIERVILLE     I-C
BEDFORD         IV-A           CROSIER          III-B         HOSMER           IV-A
BEECHER         III-A          CUBA             *VIII-B       HOUGHTON         I-A
BELKNAP         *VII-B         CYCLONE          I-C           HOYTVILLE        I-B
BELLEVILLE      I-E            DANA             IVC           HUNTINGTON       *VIII-B
BELMORE         V-A            DARROCH          III-B         HUNTSVILLE       *VIII-B
BELMORE sl      V-B            DARROCH fsl      III-C         IONA             IV-C
BERKS           IX-A           DEARBORN         *VIII-B       IPAVA            III-A
BERRIEN         V-E            DEL REY          III-A         IROQUOIS         I-D
BETHESDA        IX-A           DELMAR           III-B         IVA              III-B
BEWLEYVILLE     IV-C           DEPUTY           IV-B          JASPER           V-A
BILLETT         V-D            DESKER           V-D           JASPER sl        V-B
BIRDS           *VI-B          DICKINSON        V-C           JENNINGS         IV-A
BlRKBECK        IV-C           DIGBY            III-B         JOHNSBURG        II-A
BLOOMFIELD     V-D             DOOR             V-A           JULES            *VIII-B
BLOUNT          III-A          DOWAGIAC         V-A           JUNIUS           I-E
BOBTOWN         V-C            DRESDEN          V-A           KALAMAZOO        V-A
BONNELL         **IX-A         DRIFTWOOD        *VI-A         KALAMAZOO sl     V-B
BONNIE          *VI-B          DRUMMER          I-C           KENDALL          III-B
BONO            I-B            DU PAGE          *VIII-B       KENDALLVILLE     IV-C
BONPAS          I-B            DUBOIS           Il-A          KENTLAND         I-E
BOOKER          I-B            EBAL             **lX-A        KINDERHOOK       *IX-A
BOOTS           I-A            EDEN             IX-A          KINGS            I-B
BOURBON         III-D          EDENTON          **IX-A        KOKOMO           I-B
BOWES           V-A            EDWARDS          I-A           KOSCIUSKO        V-B
BOYER           V-C            EEL              *VIII-B       KURTZ            IX-A
BRADY           III-D          ELDEAN           V-A           LA HOGUE         III-B
BRANCH          V-D            ELKINSVILLE      V-A           LAFAYETTE        III-B
BREMS           V-E            ELLIOTT          III-A         LANDES           *VIII-B
BRENTON         III-B          ELSTON           V-C           LASH             *VIII-B
BROMER          II-A           EVANSVILLE       I-C           LAURAMIE         IV-C
BRONSON         V-C            FAIRMOUNT        **IX-A        LENAWEE          I-B
BROOKSTON       I-C            FAIRPOINT        **IX-A        LlNDSIDE         *VIII-B
BRUNO           *VIII-B        FAXON            I-C           LlNKVlLLE        IV-D
BRYCE           I-B            FINCASTLE        III-B         LINWOOD          I-A
BURNSlDE        *VIII-B        FLANAGAN         III-A         LISBON           III-B
CADlZ           IV-C           FORESMAN         V-A           LOBDELL          *VIII-B
CAMDEN          V-A            FORESMAN fsl     V-B           LOMAX            V-C
CANA            IV-B           FOX              V-A           LONGLOIS         V-A
CANEYVILLE      **IX-A         FOX sl           V-B           LOSANTVILLE      IV-B
CARLISLE        I-A            FREDERICK        **IX-A        LUCAS            IV-B
CARMEL          **IX-A         FREE             I-C           LYDICK           V-A
CARMI           V-C            FULTON           III-A         LYLES            I-D
----------------------------------------------------------------------------------------
* Soil may be subject to frequent flooding. Consult soil map or
experienced farmer for occurrance.  Change tillage management group to
"D" if needed.

**Soil may occur on lets than 18 percent slope but the landscape is
too complex to recommend a specific tillage system.
                Tillage                         Tillage                        Tillage
                Mgmt.                           Mgmt.                          Mgmt.
Soil Series     Group          Seil Series      Group         Soil Series      Group
------------------------------------------------------------------------------------------
MAHALASVILLE    I-C            PIKE             V-A           STROLE           III-A
MANLOVE         IV-C           PINEVILLAGE      *VIII-C       SUMAN            *VI-B
MAPLEHILL       *VII-B         PINHOOK          I-D           SUMAVA           III-D
MARKER          IV-C           PIOPOLIS         *VI-B         SUNBURY          III-A
MARKHAM         IV-B           PIPESTONE        III-D         SWANWICK         *IX-A
MARKLAND        IV-B           PLAINFlELD       V-E           SWITZERLAND      IV-B
MARKTON         III-D          PLANO            V-A           SWYGERT          III-A
MARTlNSVlLLE    V-A            POPE             *VIII-B       SYLVAN           IV-C
MARTlNSVILLE sl V-B            PRINCETON        V-B           SYMERTON         IV-C
MARTISCO        I-A            PROCHASKA        *VI-C         TAFTOWN          *IX-A
MAUMEE          I-E            PROCTOR          V-A           TAGGART          III-B
MCGARY          III-A          QUINN            I-D           TAMA             IV-C
MEDORA          IV-A           RAGSDALE         I-C           TAWAS            I-A
MEDWAY          *VIII-B        RAHM             *VII-A        TECUMSEH         IV-C
MELLOTT         IV-C           RAlNSVILLE       IV-C          TEDROW           III-D
MERMILL         I-C            RANDOLPH         III-A         THACKERY         V-A
METAMORA        III-C          RARDEN           *IX-A         THROCKMORTON     IV-C
METEA           IV-D           RAUB             III-B         TICE             *VII-B
MIAMI           IV-C           RAWSON           IV-C          TILSIT           IV-A
MIAMI sl        IV-D           RAWSON sl        IV-D          TIPPECANOE       V-A
MIAMIAN         IV-B           REDDICK          I-C           TOLEDO           I-B
MILFORD         I-B            REESVILLE        III-B         TORONTO          III-B
MILLBROOK       III-B          RENSSELAER       I-C           TOTO             I-A
MILLGROVE       I-D            RICHARDVILLE     IV-C          TRACY            V-C
MILLSDALE       I-B            RIDDLES          IV-C          TRAPPIST         *IX-A
MILTON          IV-B           RIDDLES sl       IV-D          TREATY           I-C
MONTGOMERY      I-B            RIDGEVILLE       III-D         TREVLAC          *IX-A
MONTMORENCI     IV-C           RIVERDALE        III-D         TROXEL           V-A
MORLEY          IV-B           ROBINSON         II-A          TUSCOLA          V-A
MOROCCO         III-D          ROBY             III-D         TYNER            V-E
MOUNDHAVEN      *VIII-C        ROCKCASTLE       IX-A          UNIONTOWN        IV-C
MUDLAVIA        V-A            ROCKFlELD        IV-C          VARNA            IV-B
MULVEY          III-B          ROCKTON          IV-D          VIGO             II-A
MUNDELEIN       III-B          RODMAN           IX-A          VINCENNES        I-C
MUREN           IV-C           ROMNEY           I-B           VOLINIA          V-A
MUSKEGO         I-A            ROSS             *VIII-B       WAKELAND         *VII-B
MUSKINGUM       IX-A           ROSSMOYNE        IV-A          WALLKILL         I-A
MUSSEY          I-D            RUARK            I-D           WARNERS          I-A
NAPOLEON        I-A            RUSH             V-A           WARSAW           V-A
NAPPANEE        III-A          RUSSELL          IV-C          WASHTENAW        I-C
NEGLEY          *IX-A          RYKER            IV-C          WATSEKA          III-D
NESIUS          V-E            SABLE            I-C           WAUPECON         V-A
NEWARK          *VII-B         ST. CHARLES      V-A           WAUSEON          I-D
NEWGLARUS       IV-B           ST. CLAIR        IV-B          WAWASEE          IV-C
NEWTON          I-E            SARANAC          *VI-A         WAWASEE sl       IV-D
NICHOLSON       IV-A           SAUGATUCK        I-E           WAYNETOWN        III-B
NINEVEH         V-A            SAWABASH         *VI-B         WEA              V-A
NOLIN           *Vlll-B        SAWMILL          *Vl-B         WEIKERT          IX-A
OAKVILLE        V-E            SCIOTOVILLE      IV-A          WEINBACH         II-A
OCKLEY          V-A            SEAFIELD         lII-D         WEISBURG         IV-A
OCTAGON         IV-C           SEBEWA           I-C           WELLSTON         IV-C
ODELL           III-B          SELFRIDGE        III-D         WESLEY           III-C
OLDENBURG       *VIII-B        SELMA            I-C           WESTLAND         I-C
ONARGA          V-C            SEWARD           IV-D          WHEELING         V-A
ORMAS           V-C            SHADELAND        III-B         WHITAKER         III-B
ORRVILLE        *VII-B         SHAKAMAK         II-A          WHITAKER sl      III-C
OSHTEMO         V-C            SHIPSHE          V-C           WHITCOMB         II-A
OTWELL          IV-A           SHOALS           *VII-B        WHITSON          I-C
OUIATENON       *VIII-C        SIDELL           IV-C          WILBUR           *VIII-B
OWOSSO          IV-D           SIMONIN          IV-D          WILHITE          *VI-A
PALMS           I-A            SISSON           V-A           WILLETTE         I-A
PAPINEAU        III-C          SKELTON          V-A           WILLIAMSPORT     III-A
PARKE           V-A            SLEETH           III-B         WILLIAMSTOWN     IV-C
PARR            IV-C           SLOAN            *VI-B         WINGATE          IV-C
PATE            *IX-A          SPARTA            V-E          WIRT             *VIII-B
PATTON          I-C            SPINKS            V-E          WOLCOTT          I-C
PEKIN           IV-A           STARKS           III-B         WOODMERE         *VIII-A
PELLA           I-C            STEFF            *VIII-B       WOOLPER          IV-B
PEOGA           II-A           STENDAL          *VII-B        WYNN             IV-B
PEOTONE         I-B            STOCKLAND        V-C           XENlA            IV-C
PETROLlA        *VI-B          STONEHEAD        *IX-A         ZABORSKY         III-D
PEWAMO          I-B            STONELICK        *VIII-B       ZADOG            I-E
PHILO           *V***-B        STOY             II-A          ZANESVILLE       V-A
PIANKESHAW      *VIII-B        STRAWN           *IX-A         ZIPP             I-B
--------------------------------------------------------------------------------------------
*Soil may be subject to frequent flooding. Consult soil map or
experienced farmer for occurrance.  Change tillage management group to
"D" if needed.

**Soil may occur on less than 18 percent slope but the landscape is
too complex to recommend a specific tillage system.
Tillage management soil groups by        Normal         Adaptability ratings for the following tillage-planting systems:a
natural drainage classes. (Repre-        slope   Deep tillage (more than 6")    Shallow tillage (less than 6")
                                         range   ---------------------------    ------------------------------
sentative soil series in paren-                 Moldboard  Chisel/Disc  Harrow      Disc/Field Cultivator   Ridge  No.
                                                ---------  -----------  ------      ---------------------   Till   Till
theses.)                                       Fall  Spring  Fall        Spring    Fall &       Spring
                                                                                   spring       only
----------------------------------------------------------------------------------------------------------------------------
I. Poorly Drained, Upland,
   Lacustrine Plains, Outwash
   Plains, and Terraces
   A. Muck and/or mineral mixture        0-2%   5      1       4           2          4          2           5      5
      (Carlisle, Houghton

   B. Silty clay loam and silt           0-2%   1      4       1           4          2          2           1b   4(3)c
      loam over clay
      (Pewamo, Montgomery)

   C. Silty clay loam and silt           0-2%   1      3       1           3          2          2           1b   3(2)c
      loam over clay loam
      (Brnoktton, Westland)

   D. Sandy loam and loam over           0-2%   4      2       3           2          3          2           1b   3(2)c
      stratified materials
      (Gilford, Lyles)

   E. Loamy sand and sand over           0-2%   5      2       3           2          3          2           2    3(2)c
      sand with and without
      finer stratified
      materials
      (Maumee)

II.Poorly and Somewhat Poorly Drained,
   Light Gray Uplands

   A. Silt loam with slowly perme-       0-2%   3      3       3           3          3          3           2b   2(1)c
      able subsoil or fragipan           2-6%   5      4       4           3          3          3           2d   2(1)c
      (Avonburg, Cobbsfork)

III. Somewhat Poorly Drained,
   Uplands, Lacustrine Plains.
   Outwash Plains and Terraces

   A. Silt loam over clay                0-2%   2      3       1           3          2          2           1b   3(2)c
      (Blount, Crosby)                   2-6%   5      4       2           3          2          2           1d   2(1)c

   B. Silt loam and loam over            0-2%   2      3       1           3          2          2           1b   3(2)c
      clay loam                          2-6%   5      4       2           3          2          2           1d   2(1)c
      (Crosier, Fincastle)

  C.  Sandy loam over clay loam          0-3%   3      2       2           2          2          2           1b   2(1)c
      (Ayrshire, Aubeenaubee)
  0.  Loamy sand and sandy loam          0-3%   5      2       3           2          3          2           2    2(1)c
     over loam or sand with
     hands of finer material
     (Brady, Morocco)

IV.Well and Mod. Well-Drained
    Uplands

   A. Silt loam over clay loam           0-2%   3      2       2           2          2          2           1      1
      with fragipan                      2-6%   5      3       3           2          2          2           1d     1
      (Cincinnati, Hosmer)               6-12%  5      4       4           3          3          3           2d     1

   B. Silt loam and loam over            0-2%   3      2       2           2          2          2           1      1
      clay                               2-6%   5      3       3           2          2          2          1d      1
      (Morley)                           6-12%  5      4       4           3          3          2          2d      1e

   C. Silt loam and loam over            0-2%   3      2       2           2          2          2           1      1
      clay loam                          2-6%   5      3       3           2          2          2          1d      1
      (Miami, Alford)                    6-12%  5      4       4           3          3          3          2de

   D. Sandy loam and loamy sand          0-2%   4      2       2           2          2          2          1       1
              over loam, clay loam       2-6%   5      3       3           2          2          2          1d      1
              or clay                    6-12%  5      4       4           3          3          3          2d      1e
              (Hillsdale, Metca)

 V.Well and Mod. Well Drained, Terraces,
   Outwash Plains, and Dunes

   A. Silt loam and loam over            0-2%   3      2       2           2          2          2           1      1
      clay loam                          2-6%   5      3       3           2          2          2           1d     1
      (Fox, Ockley)                      6-12%  5      4       4           3          3          3           2d     1e

   B. Sandy loam over clay loam          0-2%   4      2       2           2          2          2            1     1
      (Kosciusko, Princeton)             2-6%   5      3       3           2          2          2           1d     1
                                         6-12%  5      4       4           3          3          3           2d     1e


   C. Loamy sand and sandy loam          0-2%   4      3       3           3          3          2           2      1
      over thin, clay loam               2-6%   5      4       3           3          3          2           2d     1
      (Boyer, Oshtemo)                   6-12%  5      5       4           4          4          3           3d     1e

   D. Loamy sand and sandy loam          0-2%   4      3       3           3          3          2           2      1e
      over thin layers of                2-6%   5      4       3           3          3          2           2d     1e
      sandy loam                         6-12%  5      5       4           4          4          3           3d     1e
     (Bloomfield)

   E. Loamy sand and sand with           0-6%   5      4       4           3          3          2           4      1e
       and without thin bands            6-12%  5      5       5           4          4          3           5      1e
       of loamy sand
       (Chelsea, Oakville)

 VI. Poorly Drained Bottomland

   A. Clayey (occasionally flooded)      0-2%   1      4       1           4          2          2           1b    4(3)c
     (Saranac)

   B. Loamy (occasionally flooded)       0-2%   1      3       1           3          2          2           1b    4(3)c
      (Sloan)

   C. Sandy (occasionally flooded)       0-2%   3      2       2           2          2          2           2     3(2)c
      (Prochaska)

   D. All frequently flooded             0-2%   3      4       2           4          3          4           4       4

VII. Somewhat Poorly Drained
   Bottomland

   A. Clayey (occasionally flooded)      0-2%   2      3       1           3          2          2           1b   3(2)c
      (Rahm)

   B. Loamy (occasionally flooded)       0-2%   2      2       1           2          2          2           2b   3(2)c
      (Shoals)

   C. Sandy (occasionally flooded)       0-2%   5      2       3           2          3          2           2    2(1)c
      (Algansee)

   D. All frequently flooded             0-2%   3      4       2           4          3          4           4       4

VIII. Well and Mod. Well Drained
    Bottomland

   A. Clayey (occasionally flooded)      0-2%   2      3       1           3          2          2           1      1
      (Woodmere)                         2-6%   4      4       2           3          2          2           1      1

   B. Loamy (occasionally flooded)       0-2%   2      2       1           2          2          2           1      1
      (Genesee)                          2-6%   4      3       2           2          2          2           1      1

   C. Sandy (occasionally flooded)       O-2%   5      4       4           3          4          2           4      1
      (Abscota)                          2-6%   5      5       5           4          5          3           5      1

   D. All frequently flooded             0-2%   3      4       2           4          3          4           4      4
                                         2-6%   5      5       3           5          4          5           5      4
IX. Well and Mod. Well Drained           >18%
   Upland, Terraces and Outwash
   Plains

   A.Steeply sloping and or
     eroded - No tillage
     recommendations are
     made-These soils are
     best used as pasture
     or woodland.
     (Hennepin, Rodman)
------------------------------------------------------------------------------------------------------------------------------
a The tillage-planting system adaptability rating scores are defined as follows:

1 = Highly adapted.

2 = Well adapted, but limitations may occur at low frequency or over a
small part of an area. For example. spring wetness makes moldboard
plowing difficult. slower warm-up may delay plant growth. or
moderate erosion may occur with severe storms. Limitations caused by a
2 rating can be overcome with good management.

3 = Moderately well adapted, but limitations similar to those causing a
2 rating occur more frequently or over a wider area. Management will
be more difficult.

4=Marginally adapted. Limitations occur more frequently or over wider
areas than those causing a 3 rating.

5=Unadapted due to high frequency of limitations or their occurrence
over an entire area.

b Rating assumes rows follow direction of natural drainage.

c Numbers in parentheses are ratings for soybeans.

d Rating assumes rows cross-slope or on contour to lessen
runoff, channeling by erosion and washout of seed.

e If possible, use winter cover crop to provide tilth, nutrient
retention and erosion control.
Tillage management soil groups by       Normal         Adaptability ratings for the following tillage-planting systems:a
natural drainage classes. (Repre-        slope         ----------------------------------------------------------------
sentative soil series in paren-          range  Deep tillage (more than 6")       Shallow tillage (less than 6")
                                                ---------------------------       ------------------------------
theses.)                                        Moldboard    Chisel/Disc  Harrow   Disc/Field Cultivator    Ridge  No.
                                                ----------    ----------  ------    -------------------     Till  Till
                                              Fall  Spring    Fall      Spring    Fall &     Spring
                                                                                   spring     only
-----------------------------------------------------------------------------------------------------------------------------
 I.Poorly Drained, Upland,
    Lacustrine Plains, Outwash
    Plains and Terraces

   A. Muck and or mineral mixture        0-2%   5      2        5           3        5           3           5      4
      (Carlisle, Houghton)
   B. Silty clay loam and silt           0-2%   1      4        1           4        2           2           1b     2
      loam over clay
       (Pewamo, Montgomery)
   C. Silty clay loam and silt           0-2%   1      3        1           3        2           2           1b     2
      loam over clay loam
      (Brookston, Westland)
   D. Sandy loam and loam over           0-2%   4      2         3          2        3           2           1b     2
      stratified materials
      (Gilford, Lyles)
   E. Loamy sand over sand with          0-2%   5      3         4          3        4           3            2     2
      and without finer
      stratified materials
      (Maumee)

II.Poorly and Somewhat Poorly
   Drained, Light Gray Uplands

   A. Silt loam with slowly              0-2%   3      3         3          3        3           3            2b     1
      permeable subsoil or               2-6%   5      5         5          4        4           4            2d     1d
      fragipan
      (Avonburg, Cobbsfork)

III. Somewhat Poorly Drained,
   Uplands, Lacustrine Plains,
   Outwash Plains and Terraces

   A. Silt loam over clays               0-2%   2      3         1          3        2           2            1b     2
      (Blount, Crosby)                   2-6%   5      5         3          4        3           3            1c     1d
   B. Silt loam and loam over            0-2%   2      3         1          3        2           2            1b     2
      clay loam                          2-6%   5      5         3          4        3           3            1c     1d
      (Crosier, Fincastle)
   C. Sandy loam over clay loam          0-3%   3      2         2          2        2           2            1b     1
      (Ayrshire, Aubeenaubee)
   D. Loamy sand and sandy loam          0-3%   5      3         4          3        4           3            2      1
      over loam or sand with
      bands of finer material
      (Brady, Morocco)

IV.Well and Mod. Well-Drained
   Uplands
   A. Silt loam over clay loam           0-2%   3      2         2          2        2           2            1      1
      with fragipan                      2-6%   5      4         4          3        3           3            1c     1d
      (Cincinnati, Hosmer)               6-12%  5      5         5          4        4           4            2c     1d
   B. Silt loam over clay                0-2%   3      2         2          2        2           2            1      1
      (Morley)                           2-6%   5      4         4          3        3           3            1c     1d
                                         6-12%  5      5         5          4        4           4            2c     1d
   C. Silt loam and loam over            0-2%   3      2         2          2        2           2            1      1
      clay loam                          2.6%   5      4d        4          3        3           3            1c     1d
      (Miami, Alford)                    6-12%  5      5d        4          4        4           4            2c     1d
   D. Sandy loam and loamy sand          0-2%   5      3         3          3        3           3            1      1
      over loam, clay loam,              2-6%   5      4d        4          3        3           3            1c     1d
      or clay                            6-12%  5      5d        5          4        4           4            2c     1d
     (Hillsdale, Metea)

 V.Well and Mod. Well Drained,
   Terraces, Outwash Plains,
   and Dunes

   A. Silt loam and loam over            0-2%   3      2         2          2        2           2            1      1
      clay loam                          2-6%   5      4d        4          3        3           3            1c     1d
      (Fox, Ockley)                      6-12%  5      5d        5          4        4           4            2c     1d
   B. Sandy loam over clay               0-2%   4      2         2          2        2           2            1      1
      loam                               2-6%   5      4d        4          3        3           3            1c     1d
      (Kosiusko, Princeton)              6-12%  5      5d        5          4        4           4            2c     1d
   C. Loamy sand and sandy loam          O-2%   5      4         4          4        4           3            2      1
      over thin, clay loam               2-6%   5      5d        4          4        4           3            2c     1d
      (Boyer, Oshtemo)                   6-12%  5      5d        5          5        5           4            3c     1d
   D. Loamy sand and sandy loam          0-2%   5      4         5          4        4           3            2      1d
      over thin layers of                2-6%   5      5d        5          5        5           4            2c     1d
      sandy loam                         6-12%  5      5d        5          5        5           5            3c     1d
      (Bloomfield)
   E. Loamy sand and sand with           0-6%   5      5         5          4        4           3            4      1d
       and without thin bands            6-12%  5      5d        5          5        5           4            5      1d
       of loamy sand
       (Chelsea, Oakville)

 VI. Poorly Drained Bottomland

   A. Clayey (occasionally flooded)      0-2%   1      4         1          3        2           2            1b     2
      (Saranac)
   B. Loamy (occasionally flooded)       0-2%   1      3         1          3        2           2            1b     2
      (Sloan)
   C. Sandy (occasionally flooded)       0-2%   3      2         2          2        2           2            2      2
      (Prochaska)
   D. All frequently flooded             0-2%   3      4         2          4        3           4            4      4

 VII. Somewhat Poorly Drained
   Bottomland

   A. Clayey (occasionally flooded)      0-2%   2      3         1          3        2           2            1b     2
      (Rahm)
   B. Loamy (occasionally flooded)       0-2%   2      2         1          2        2           2            1b     1
      (Shoals)
   C. Sandy (occasionally flooded)       0-2%   5      3         4          3        4           3            2      1
      (Algansee)
   D. All frequently flooded             0-2%   3      4         2          4        3           4            4      4

VIII. Well and Mod. Well Drained
   Bottomland
   A. Clayey (occasionally flooded)      0-2%   2      3         1          3        2           2            1      1
      (Woodmere)                         2-6%   5      5         3          4        3           3            1c     1
   B. Loamy (occasionally flooded)       0-2%   2      2         1          2        2           2            1      1
      (Genesee)                          2-6%   5      4         3          3        3           3            1c     1
   C. Sandy (occasionally flooded)       0-2%   5      5         5          4        5           3            4      1
      (Abscota)                          2-6%   5      5         5          5        5           4            5      1
    D. All frequently flooded            0-2%   3      4         2          4        3           4            4      4
                                         2-6%   4      5         3          2        4           5            5      4

 IX.Well and Mod. Well Drained
   Uplands, Terraces and Out-
   wash Plains

   A.Steeply sloping and or
     eroded - No tillage
     recommendations are made -
     These soils are best used
     as pasture or woodland.
     (Hennepin, Rodman)
--------------------------------------------------------------------------------------------------------------------------
a The tillage-planting system adaptability rating scores are defined as follows:

1 = Highly adapted.

2 = Well adapted, but limitations may occur at low frequency or over a
small part of an area. For example. spring wetness makes moldboard
plowing difficult, slower warm-up may delay plant growth, or moderate
erosion may occur with severe storms.  Limitations caused by a 2
rating can he overcome with good management.

3 = Moderately well adatred, but limitations similar to those causing a
2 rating occur more frequently or over a wider area. Management will
be more difficult.

4 = Marginally adapted. Limitations occur more frequently or over
wider areas than those causing a 3 rating.

5 = Unadapted due to high frequency of limitations or their occurrence
over an entire area.

b Rating assumes rows follow direction of natural drainage or stream
flow.

c Rating assumes rows cross-slope or on contour to lessen runoff,
channeling by erosion and washout of seed.

d Winter cover crop must be used to provide tilth, nutrient retention,
and erosion control.
                                                     Ratings for tillage-planting systems
Soil Series,       Domi-   Tillage  Fall     Spring                   Fall &
Surface Texture    nant    -Mgmt.   Mold-    Mold-   Fail     Spring  Spring   Spring  Ridge   No
and No. of Acres   Slope   Group    board    board   Chisel   Chisel  Disk     Disk    Till    Till
---------------------------------------------------------------------------------------------------------

Field A

 Crosby sil-16O     1-3%    III-A     2        3       1        3       2        2       1      3
 Brookston sicl-80  0-1%    I-C       1        3       1        3       2        2       1      3
 Miami sil-80       2-6%    IV-C      5        3       3        2       2        2       1      1

Field B

 Miami sil-20       6-12%   IV-C      5        4       4        3       3        3       2      1
 Fox sil-60         1-4%     V-A      5        3       3        2       2        2       1      1

Field C

 Homer sil-40       1-2%    III-B     2        3       1        3       2        2       1      3
 Westland sicl-80   0-1%     I-C      1        3       1        3       2        2       1      3
 Genesee sil-6O     1-2%    VIII-B    2        2       1        2       2        2       1      1
----------------------------------------------------------------------------------------------------------
 Tillage    Soil Resource  Soil Resource  Soil Resource  Soil Resource    Soil         Resource
Management      Area A         Area B         Area C          Area D     Area E        Area F
Soil Group  %    Acres     %    Acres      %    Acres     %     Acres   %    Acres    %    Acres
--------------------------------------------------------------------------------------------------------
IA           7    276.6   <1      28.9    <1     16.6    <1       2.2          0             0
IB           2     89.5   24     797.7     4    317.8     2      71.3   <1     7.0   <1      2.9
IC          12    491.7    2      81.9    24  1,731.4     6     194.4   <1    24.1   <1      0.1
ID           6    219.0   <1       1.3    <1      5.1     1      41.8          0     <1      1.7
IE           8    329.4   <1       0.3            0      <1       1.2          0             0
IIA                 0              0              0       4     112.8    4   143.9   21    322.5
lIIA         4    144.3   32   1,070.3    15  1,074.6    <1      19.2   <1     5.4   <1      0.8
IIIB         8    320.4    2      82.9    14  1,026.4     8     260.6   <1     8.2   <1      6.3
IIIC        <1     27.1            0      <1      0.5     1      45.5          0     <1     10.5
IIID         6    218.8            0      <1      0.2             0     <1     2.7           0
IVA                 0              0              0      20     650.9   22   849.8   27    410.0
IVB          3    127.1   24     790.2     4    261.3    <1      16.5    2    59.1   21      7.8
IVC          8    316.7    2      58.3    18  1,297.1    12     395.9   19   772.7   2      28.2
IVD          5    198.0    1      33.2    <1      0.3             0            0             0
VA           2     84.0    2      61.2     7    491.6     3     108.6    1    52.8    2     25.7
VB           2     81.1   <1      10.1    <1     22.6     I      42.1   <1     3.0   <1      0.2
VC          10    391.9   <1      27.4    <1     39.7     1      39.6          0     <1      3.0
VD          <1      7.8            0      <1     12.8     2      71.3   <1     8.9   <1     11.6
VE          10    393.6   <1       5.0    <1      8.5    <1       1.1   <1     0.4   <1      0.7
VIA         <1      0.5   <1       0.9    <1      6.3             0            0             0
VIB         <1     18.0   <1       9.6    <1     29.2     2      60.1   <1     8.5   <1      5.8
VIC         <1      7.5            0              0               0            0             0
VID         <1     27.2    1      33.1    <1     20.8     2      49.4   <1     5.8    1     21.9
VIIA                0              0              0      <1       1.6   <1     1.1   <1      0.4
VIIB        <1      6.1    1      36.9     1     96.5     5     159.7    2    72.7   2      38.6
VIIC        <1      3.6            0              0               0            0             0
VIID        <1      0.8   <1       9.9    <1     13.2     4     116.3   <1    35.2  <1      13.3
VIIIA               0              0              0      <1       4.8          0             0
VIIIB       <1      3.1    1      40.6     4    324.7     7     224.7    4   162.5   3      50.3
VIIIC       <1      1.6            0      <1      0.8             0            0    <1       2.2
VIIID       <1      2.3   <1      24.9    <1     18.4     2      77.7    2    74.3   2      36.9
IXA          4    166.3    2      60.0     6    451.1    13     418.6   42 1,637.2  35     534.3
                 -------         -------       -------         ------       ------        --------
Total             3,957.0        3,264.6        7,267.5       3,187.9      3.935.3       1,535.7
---------------------------------------------------------------------------------------------------
RR 4/90
Cooperative Extension work in Agriculture and Home Economics, state of Indiana, Purdue University, and U.S. Department of Agriculture cooperating; H. A. Wadsworth, Director, West Lafayette, IN. Issued in futherance of the acts of May 8 and June 30,1914. Purdue University Cooperative Extension Service is an equal opportunity/equal access institution.