EC-703
This publication offers a method for surveying commuting patterns. It brings data together in a simple fashion to show Indiana's commuting trends. Where people work, where they commute from, and why they travel are questions that need to be answered to understand local economies. Commuting patterns can provide valuable information about a community's economic structure.
Where people live and where people work can provide useful information for community development planning. For instance, analysis of commuting patterns1 can provide information to direct transportation planning or related infrastructure issues. Analysis of commuting patterns can identify issues that community leaders may wish to explore as they investigate economic development policy options.
An economic indicator, such as commuting patterns, is a fact and/or a statistic that describes or measures some aspect of the economic structure of a community. An indicator may be used on its own to distinguish information for local authorities concerned with economic development. Indicators may also be used in conjunction with other indicators as an analytical tool.
This publication examines cross-county place of residence-place of work commuting patterns for Indiana counties. The first section of the publication defines commuting patterns and provides a general discussion about how commuting patterns can be used to gain insight into local economies. The second section provides a brief discussion of cross-state commuting patterns. The third section provides a description of the cross-county commuting between Indiana counties. The fourth section examines commuting patterns within an Indiana labor market area (LMA) and discusses how the data can be utilized to raise questions that improve the understanding of the local county economy. The fifth section displays commuting patterns for each of the counties in the LMA. Last, the publication provides a glossary and bibliography to assist the reader.
Commuting patterns represent flows of people (commuters) who reside in one region and travel to another region for employment. Commuters are divided into two categories: outcommuters and incommuters. Outcommuters are those people who reside in a specified region and commute to another region for employment. Incommuters are the people who reside in another region and, for employment reasons, commute to the specified region.
By studying commuting patterns, one can begin to understand the economic structure of a local economy. Commuting patterns illustrate if residents are being employed within the region or if residents are traveling to nearby regions for employment. A high level of incommuters suggests that the local economy is providing employment opportunities for both residents and non-residents. The employment opportunities in the community are attractive to residents of other communities, as evidenced by their willingness to travel for employment.
A high level of outcommuters may indicate several economic situations. The local economy may have a limited number of employment opportunities, a nearby community may have employment opportunities which are more attractive to resident workers, or the specified community may have a higher level of amenities for residents than communities closer to employment sources.
Commuting patterns also provide some insight into wage and income discrepancies between communities. Large numbers of commuters may indicate a wage difference between communities. As people commute for work, they are incurring additional costs, namely travel expense and loss of time. Workers will commute to different communities for compensation such as higher wages, job security, or other reasons as long as the benefits of commuting outweigh the costs associated with commuting. Therefore, a large number of commuters between communities may point to some type of compensation discrepancy between the communities.
Amenity differences between communities may also be explained by commuting patterns. Not only do wages act as a form of compensation to commuters, but amenities in the county where they reside may be a type of compensation for workers. If workers are willing to reside in a county that is not "close" to employment sources, the county of residence may have some benefits for residents. The county could be less densely populated, contain more affordable housing, provide better services, have less crime, or possess an overall atmosphere that promotes the development of residential sectors. These amenities may serve as a form of compensation and account for large outcommuting levels.
Commuting patterns may also indicate the presence of transportation infrastructure. Interstates, four-lane highways, and commuter rail have been designed to reduce transportation time. By decreasing time, these infrastructure developments decrease the opportunity costs of commuting, which could in turn lead to an increased number of commuters. Counties with interstates, four-lane highways, and similar transportation infrastructures within their borders may possess higher commuting levels as the costs of commuting decrease.
Also, transportation infrastructure is an important aspect in business development. Transportation infrastructures provide access to different product markets. By stimulating business development, transportation infrastructures increase employment opportunities for local workers and potential commuting workers.
The economic structure of the state and individual counties can be described using commuting statistics.2 Commuting patterns for the state assist in describing some of the economic development patterns within Indiana. Studying cross-county commuting patterns helps differentiate communities on the basis of their implied levels of economic development, wage, and income differentials.
Indiana has about 2.6 million resident workers. Over one-half million of these workers, or 24%, commute across county borders to work. Also, 110,000 resident Indiana workers (4.5%) commute to neighboring states to work. Illinois and the Chicago area receive about one-half of these workers. In return, more than 76,000 people commute to Indiana. Twenty-two thousand workers come from Illinois, and about 19,000 commute from Kentucky and Michigan each.
It is not surprising that Indiana has a net loss of commuters, since Chicago borders Indiana on the northwest, and Louisville and Cincinnati lie on the southeastern border. It is noteworthy that Michigan sends about 15,000 more commuters to Indiana than it receives. This statistic is explained by the fact that Gary and South Bend are near the Michigan border. The exact numbers of outcommuters and incommuters to each of Indiana's neighboring states are listed in Table 1.
Neighboring States     Outcommuters from        Incommuters
                           Indiana              to Indiana
-----------------------------------------------------------
Illinois                   52,424                 21,895
Kentucky                   39,608                 18,720
Michigan                    6,244                 21,467
Ohio                       17,805                 14,324

Total                     116,081                 76,406
----------------------------------------------------------
Outcommuting and Outshare
In Indiana, cross-county commuting is prevalent. Sixty of the counties in Indiana experience at least 30% of their resident workers crossing county lines to find employment. On average, 35% of the workers in each Indiana county commute to other counties. Only seven counties within the state--Allen, Dubois, Elkhart, Marion, Tippecanoe, Vanderburgh, Vigo--have less than 10% of their workers commuting out of the county. Tippecanoe County has the lowest percentage of people commuting out of the county at 6%, and Ohio County has the highest percentage at 75%. The five counties with the lowest percentage of residents commuting to other counties are given in Table 2, and the five counties with the highest percentage of outcommuting residents are given in Table 3. The charts also list the total number of outcommuters and the number of county residents who are employed.
             Lowest Percent Outcommuters

                                Resident
   County      %       Total    Workers
------------------------------------------
 Tippecanoe    6      3,488     62,798
 Allen         7     10,131    149,812
 Dubois        8      1,515     19,050
 Marion        8     31,534    395,165
 Elkhart       9      6,877     79,282
------------------------------------------
             Highest Percent Outcommuters

                                Resident
  County      %       Total     Workers
-----------------------------------------
 Ohio         75      1,737      2,325
 Warren       65      2,324      3,594
 Hendricks    64     24,244     37,953
 Hancock      63     14,136     22,532
 Franklin     63      5,431      8,636
----------------------------------------
The counties with the lowest percentages of outcommuters are metropolitan counties. Tippecanoe contains West Lafayette and Lafayette; Allen contains Ft. Wayne; Elkhart is part of the South Bend area; and Indianapolis is in Marion County. The counties with the highest percentages of outcommuters are counties that border metropolitan centers. Warren County neighbors Tippecanoe County; Hendricks and Hancock Counties both border Marion County; and Franklin County is near Interstate 74, a direct link to Cincinnati, Ohio.
The percentage of resident workers who commute out of Indiana counties is illustrated in Figure 1. The percentage of outcommuting resident workers is called outshare. The counties with the lowest levels of outcommuters tend to be surrounded by counties with above average levels of outcommuters. Tippecanoe and Vigo counties are each surrounded by four counties with above average outshare levels. Marion County is surrounded by six counties characterized by 50% or more of their residents who outcommute. Within a two-county radius of Marion County, there are eight counties with an outshare level of 50% or more. Crawford, Harrison, and Floyd counties in southern Indiana, which neighbor Louisville, are characterized by an outshare level between 50 and 60%.
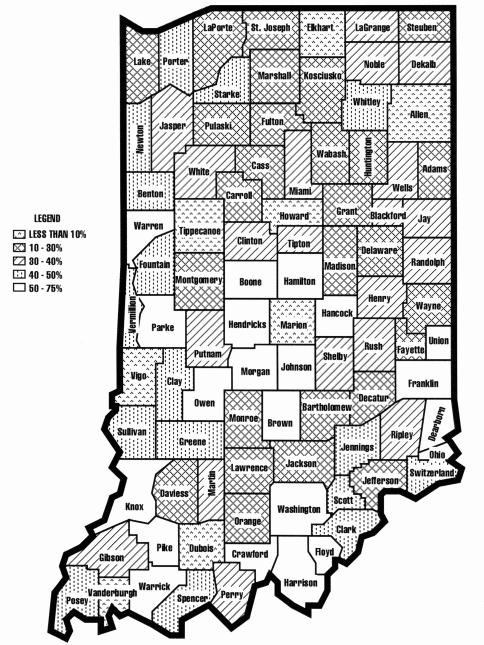
The geographic location of counties suggests that the low outshare level counties are metropolitan centers with higher levels of economic development. The labor markets employ county residents and large portions of workers from neighboring counties. In general, these metropolitan areas not only employ 90+ % of their resident workers above the age of 16, but 40+ % of the residents of several neighboring counties.
The geographic location of high and low outshare counties may also indicate amenity differences between counties, as mentioned above. High outshare counties may have amenities which entice resident workers to live in the county and commute to their jobs. The amenities compensate for the costs of commuting to employment sources.
Similar to outshare levels, the number of incommuters distinguishes between metropolitan counties and non-metropolitan counties. Listed in Table 4 are five counties that receive the most commuters and the five counties that receive the fewest commuters from other counties are listed in Table 5. Also in the tables are the percentage of workers in the county who commute from other counties and the total number of people who work in the county.
                   Highest Number of
                      Incommuters

  County      Total      %     Local Jobs
-------------------------------------------
 Marion      134,972    28.4   475,089
 Lake         36,732    19.6   187,590
 Allen        25,008    15.4   162,201
 Elkhart      25,781    26.2    98,186
 Vanderburgh  24,586    26.1    94,113
------------------------------------------
                   Lowest Number of
                      Incommuters

 County      Total    %     Local Jobs
-----------------------------------------
 Ohio         101    14.6      689
 Warren       404    24.0    1,674
 Union        337    21.0    1,572
 Switzerland  358    17.7    2,018
 Crawford     350    17.6    1,989
-----------------------------------------
Again, the total number of incommuters distinguishes between metropolitan and rural areas. The counties receiving the most commuters are metropolitan areas: Indianapolis is in Marion County; Lake County is part of the Chicago area; Allen County contains Fort Wayne; Elkhart County has Elkhart and the South Bend area located in its borders; and Evansville is located in Vanderburgh County. Ohio, Warren, Switzerland, Crawford, and Union are all small rural counties.
The map in Figure 2 illustrates the percentage of county jobs filled by commuters from other counties. This percentage is called incommuteshare and is derived by dividing the total number of incommuters by the total number of jobs in the county. incommuteshare levels indicate the ability of local labor markets to attract workers from other counties. The counties with the lowest incommuteshare levels tend to border counties which have a large proportion of outcommuters going to a metropolitan area for employment.
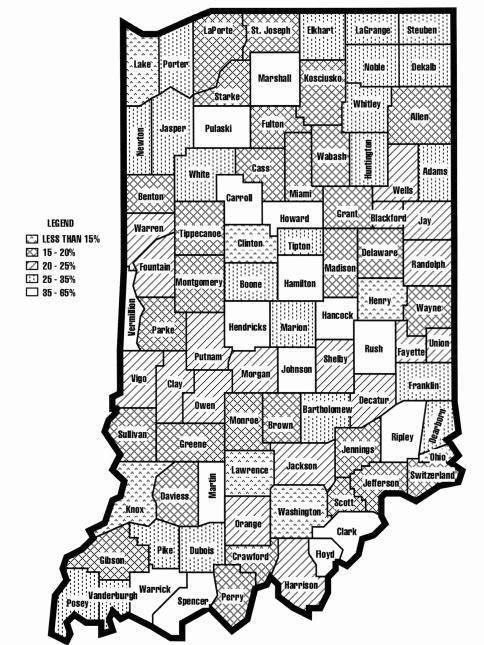
Clinton County exemplifies this phenomena. Clinton County is between Tippecanoe, Boone, and Hamilton counties. Tippecanoe County is a metropolitan county, and Boone and Hamilton counties both border Marion County, another metropolitan county. The low incommuteshare level for Clinton County indicates that the local labor market is not able to attract workers from other counties. The Tippecanoe and Marion labor markets are providing more attractive employment opportunities for commuting workers than the Clinton local labor market. Other counties with inshare levels between 10-15% are in similar geographic situations.
The Indiana counties with 40% or higher incommuteshare levels border metropolitan counties. Four out of the five counties also have above average levels of outcommuters. This information suggests that although many resident workers commute to metropolitan areas for employment, the local labor market is still able to attract workers from other counties. What does this indicate about the economic structure in counties with high incommuteshare and outshare levels? Two scenarios may be possible.
First, some of the counties may have used their proximity to the metropolitan area and located businesses within the county, which in turn attract workers from other bordering counties. The metropolitan area may have an employment sector requiring specific labor skills that attracts a large number of outcommuters from this high incommuteshare, outshare county. This county may have developed an employment sector requiring labor skills possessed by residents of bordering counties, accounting for high inshare levels.
High incommuteshare levels may be caused by the establishment of service industries to support the people who commute to the metropolitan area. As resident workers commute to neighboring localities, incommuters arrive to fill service jobs needed to support large numbers of outcommuters.
In the second scenario, businesses may not have located in the county. The large incommuteshare percentage may be caused by a lack of workers associated with a large number of outcommuters. Since a small number of businesses locate in the county, the employment opportunities are small in number, so only a small number of incommuting workers is needed to create high incommuteshare levels.
The differences in the economic structure among high incommuteshare counties can be distinguished by the total number of incommuters. For instance, Floyd, Clark, and Vermillion counties have high incommuteshare and outshare levels. Floyd and Clark have 16,665, and 19,908 incommuters, respectively, but Vermillion County has 3,356. This suggests that Floyd and Clark counties have developed larger economies than Vermillion County. Floyd and Clark counties attract 10,000 more workers from neighboring counties than does Vermillion County.
Commuting pattern data begin to provide information on the economic structure of a county or labor market area (LMA).3 Commuting patterns indicate the attractiveness of the county labor market to workers and businesses. The economic structure of counties can be compared on the basis of this attractiveness.
First, the comparison is based upon the levels of outcommuters and incommuters. A large number of outcommuters suggests that the labor market is not as attractive as other labor markets. The large number of outcommuters may suggest that the amenities in this county are high for resident workers. A large number of incommuters may suggest that the labor market is attractive to businesses who locate in the county and to workers from other labor markets.
Second, the distance outcommuters and incommuters travel may be used to compare the attractiveness of labor markets in counties. It suggests that counties may have a more attractive job sector if people commute from a greater distance for employment in the county. A county with commuters coming from a five-county radius may contain a more attractive job sector than a county that employs workers from a two-county radius.
Commuting patterns may also provide insight into the amenities of a county. A county with a large number of outcommuters may suggest that the benefits of residing in this county are high, because residents are willing to incur the costs of traveling to find employment. The commuting distance may indicate the level of amenities within a community. A county characterized by residents who commute a greater distance than those in another county may indicate amenities that compensate residents for the increased costs of commuting.
Commuting patterns can guide analysis of work force skill levels and employment skill requirements in a county. What skills do workers possess that allow them to commute, or what skills do they lack which prevent them from commuting? Other questions may arise concerning job requirements. What skills are jobs demanding in the labor market? What are the job requirements, and are these requirements forcing resident workers to commute for employment?
Not only do commuting patterns raise questions, commuting patterns can help provide answers, given other information. For instance, a county may have a large portion of high-skill workers if it has a large number of resident workers commuting to a neighboring county characterized by high-skill/high-wage jobs. Also, the county may lack a high-skill job market, or the high-skill jobs available are not attractive to residents when compared to the jobs in the neighboring county. A county with a low-skill labor force and a low level of outcommuters suggests that residents are finding attractive low-skill jobs available where they reside or that residents do not possess the skills needed to compete in neighboring job markets.
Information of this type allows local officials to focus development strategies to meet the needs of the county. The efforts could focus on increasing the attractiveness of existing job opportunities, promoting the development of new job opportunities that match the skill levels of the county labor force, developing infrastructure such as transportation systems which attract new businesses or allow different workers to enter the labor market, or creating programs that teach the skills needed for workers to compete in various job markets.
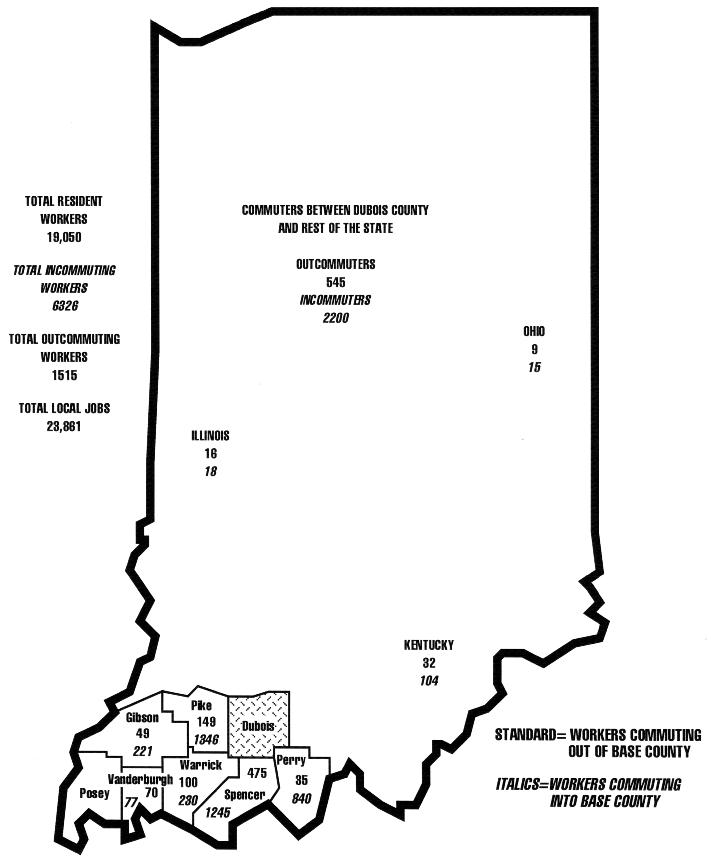
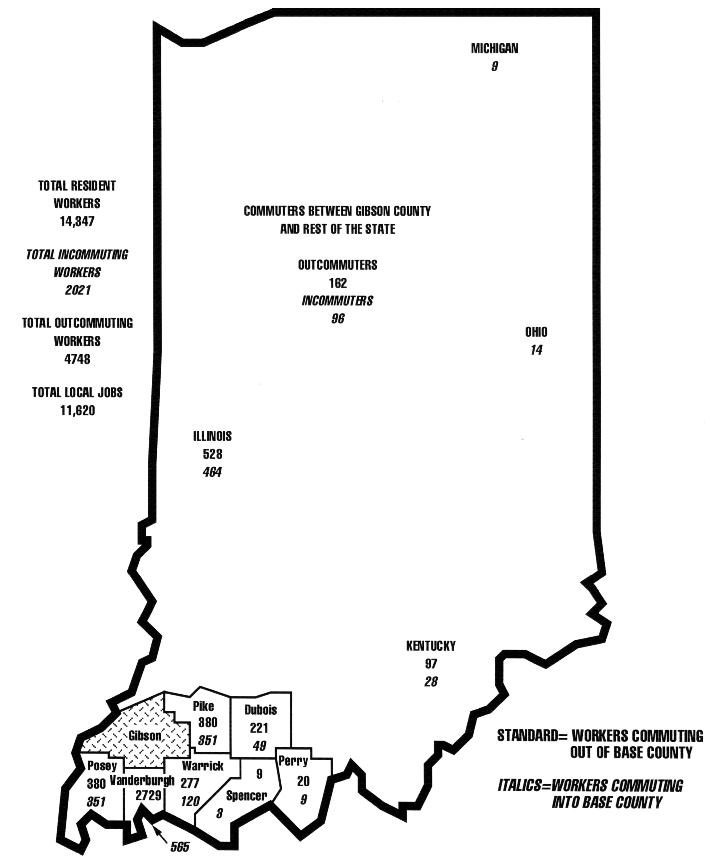
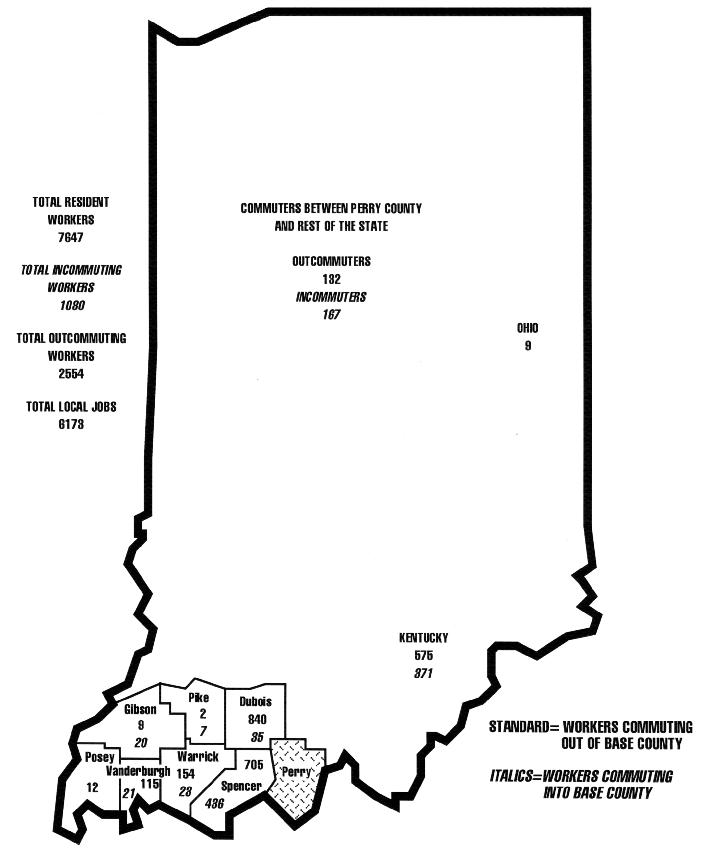
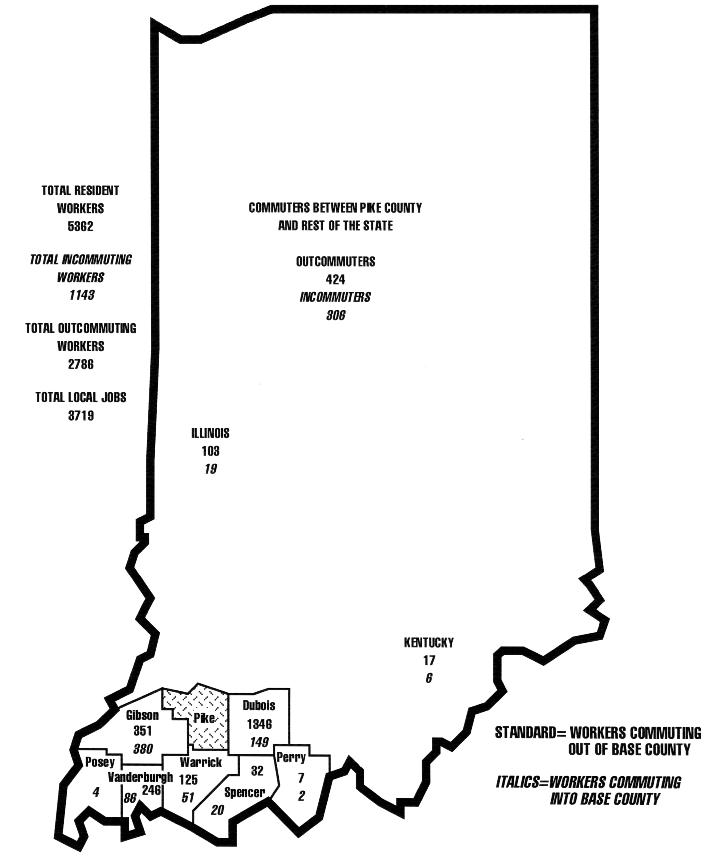
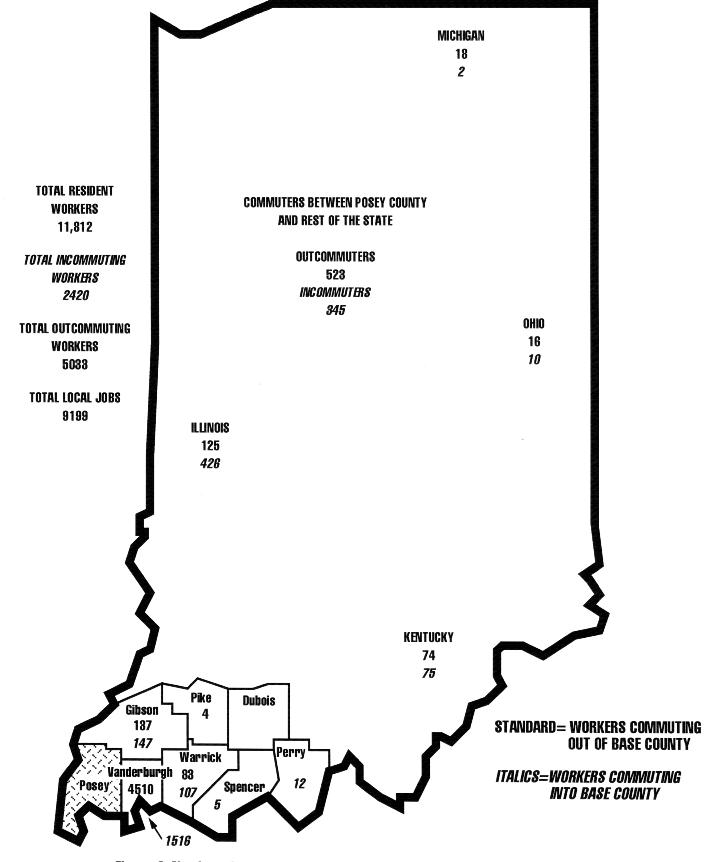
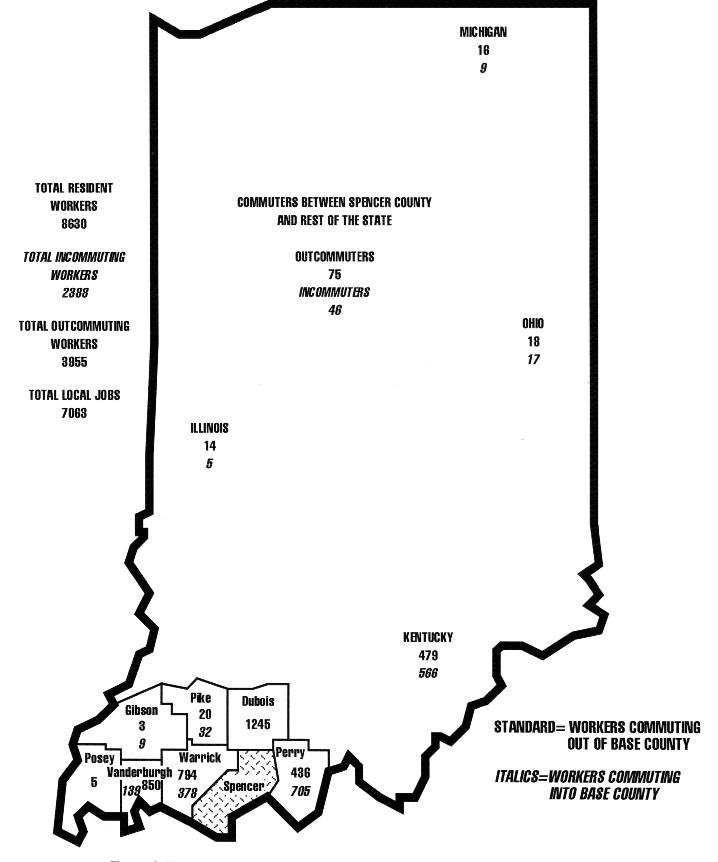
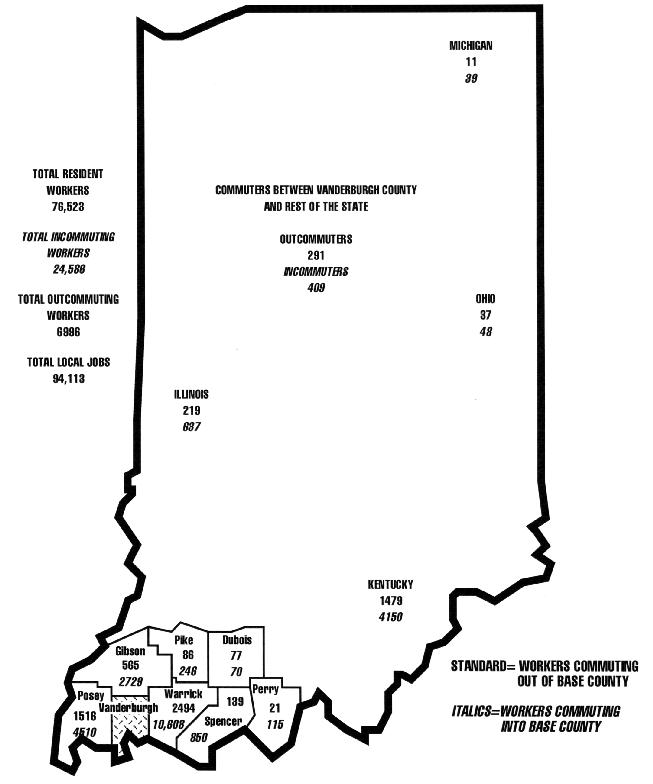
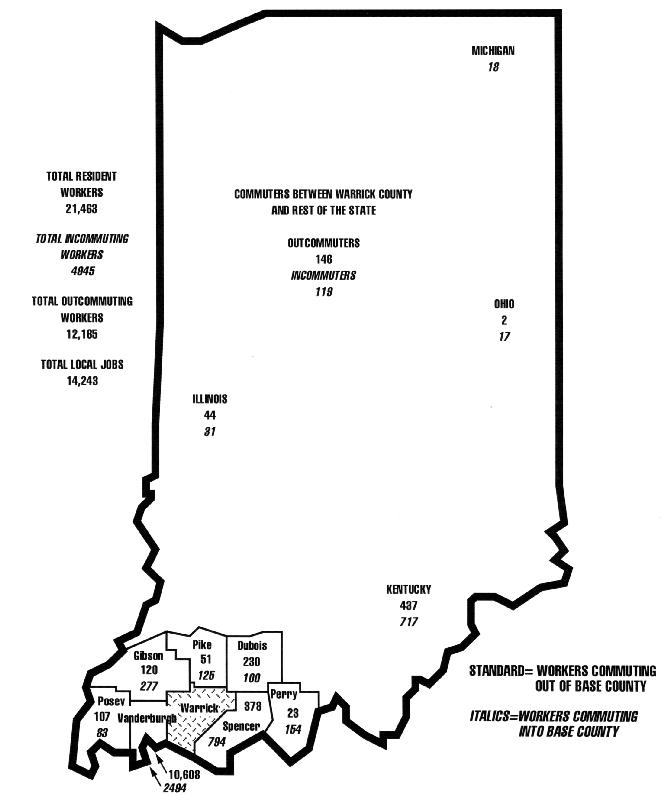
At the end of this publication, maps are provided to display the commuting patterns for each county in the Evansville LMA. The maps are produced to aid local leaders in the collection and use of data as they analyze the economic structure of their county and surrounding counties. Each county of reference is shaded. The bold type represents the number of workers who commute out of the specified county for employment, and the italicized type represents the number of people who commute into the referenced county from neighboring counties.
The first map, Figure 3, is for Adams County, in the Fort Wayne LMA. The map is explained in some detail to serve as an example of how to interpret the maps provided and of how commuting patterns can be used to guide a person's study of a county economy.
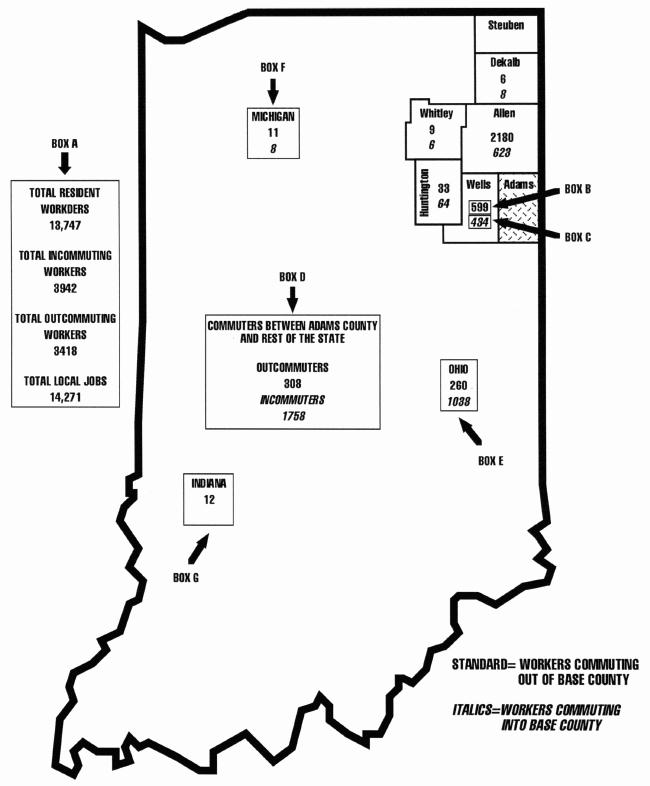
In Figure 3, Adams County is shaded to show the point of reference. The total number of incommuting workers, outcommuting workers, residents workers, and number of local jobs for Adams County are listed in Box A. Resident workers are the people, 16 years of age or older, who live in the county and are employed. (The number of local jobs was determined by adding the total number of incommuters to the number of resident workers and subtracting the number of outcommuters.) Adams County has 13,747 residents who work, 14,271 local jobs, and more people commute into the county (3,942 people) than commute out of the county (3,418 people) for employment.
Box B shows that 599 people commute out of Adams County to Wells County, which borders Adams County on the west, to work. Box C shows that 434 people from Wells County commute into Adams County for employment. Outcommuting workers from Adams County are printed in bold, and incommuting workers to Adams County are printed in italics. The number of incommuters and outcommuters are shown for each county in the labor market area. Commuters between Adams County and other Indiana counties are combined and displayed in Box D. Adams County has 308 residents who commute to other counties in Indiana and 1,758 non-residents who commute into Adams County from other Indiana counties.
The map also shows the number of workers commuting to and from neighboring states. Each state has its name by its geographic location on the map (Boxes E, F, and G). The number of workers commuting out of and into Adams County are listed below the state name and are distinguished in the same manner as they are for Indiana counties. For example, 260 people commute out of Adams County to Ohio, and 1,038 people commute into Adams County from Ohio (Box G).
The commuting data for Adams County provide general information that can direct the evaluation of specific aspects of the local economy. More people commute into Adams County for work than commute out (3,942 incommuters and 3,418 outcommuters). The total number of resident workers is 13,747, and 25% of these workers commute to other counties for employment. Most of these commuters do not travel far: 2,180 commute north to Ft. Wayne-Allen County. Also, 83% of Adams County's outcommuters travel to counties in the Ft. Wayne labor market area. Twenty-nine percent of Adams county's incommuters come from counties in the Ft. Wayne labor market area. Adams county also has a large proportion of its incommuters coming from Ohio (1,038) and other labor market areas (1,758) in the state.
The percentage of resident workers who outcommute (25%) is below the state average. Also, there are more incommuting workers (3,492) than outcommuting (3,418). This means that Adams County does have ample employment opportunities for its residents. Most of the cross-county economic activity is associated with Allen County, the county containing Fort Wayne, Indiana's second largest city. The larger number of incommuters in Adams County than outcommuters suggests that the employment opportunities in Adams County are attractive for some sectors relative to other counties. The largest share of incommuters to Adams County comes from other labor market areas (1,758). This may reflect the location of Adams County within the Ft. Wayne labor market area and in the state. Residents to the south of Adams County may be commuting north in search of jobs and higher wage levels that could be prevalent in Adams County as well as Allen County.
The commuting patterns suggest several questions related to understanding the Adams County economy. One, why are local residents outcommuting for work instead of competing for employment in the county economy? Does Adams County possess a larger number of amenities compared with neighboring counties? Are outcommuters going to high skill/high wage jobs? Or, do county residents lack the skills to compete in the local job market, so they must seek employment requiring lower skills in the larger economy of Fort Wayne? Two, what attracts people from outside the county to jobs within the county? Are the incommuters searching for high-skill/high-wage jobs or are they finding employment that requires lower skills?
Adams County's proximity to Fort Wayne- Allen County could be an asset as it attempts to entice business development. If the cross-county commuting for work is a result of residents seeking higher wages, Adams County may be able to entice businesses to locate in the county to take advantage of lower production costs. Analysis of the skill levels of Adams County residents compared to neighboring counties may be beneficial in understanding commuting patterns. If the residents of Adams County are low-skill workers and are commuting to Allen County, Adams County officials could focus their development strategies on the creation of low-skill jobs or skill training programs for Adams County residents.
Commuting maps similar to that for Adams County are provided for each Indiana county in the Evansville LMA in alphabetical order at the end of this publication. Publications containing maps with information about other labor market areas in Indiana are also available.4 Commuting pattern data provide one source of information, an economic indicator, to use in understanding a local economy.
The authors would like to thank Pat Martin and Steve Smith, Indiana Department of Transportation (INDOT), and Tim Pritchard, Ohio State University, for their comments on an earlier draft of this paper.
New 9/95
Cooperative Extension work in Agriculture and Home Economics, state of Indiana, Purdue University, and U.S. Department of Agriculture Cooperating; H.A. Wadsworth, Director, West Lafayette, IN. Issued in furtherance of the acts of May 8 and June 30, 1914. The Cooperative Extension Service of Purdue University is an affirmative action/equal opportunity institution.