Machine Usage in Manufacturing Value-Added Wood Products
By Rado Gazo and Richard P. Vlosky
Abstract
A study of equipment usage in the Louisiana secondary wood products
industry was conducted in 1994. The objectives of this study were
to determine types of machines used by the value-added industry sector
and to identify commonalties of types of machines used between industry
segments. For the purpose of this analysis, if a product was produced
by more than 10 companies, it was considered a separate value-added
wood industry. Five separate value-added industries were identified
using this scheme: kitchen cabinets, millwork, household furniture,
bathroom cabinets, and pallets. Differences between types of equipment
used in companies of different sizes and between industry sectors
were statistically analyzed. There are two main implications from
identifying the most frequently used types of machines in and between
industry segments. The first is in the area of developing secondary
industry training and development programs. Specific machine center
training can be aligned to targeted markets and products. Second,
companies considering horizontal diversification can determine the
degree of machine center commonality between industry and product
segments.
Introduction
The secondary, or value-added, woodworking industry produces a variety
of products. These products can be grouped based on their function,
types of materials and technologies used in their production. Examples
of product groups are furniture, casework, and millwork. There are
a number of studies that analyze these wood product groups based on
material usage found (2, 5, 7, 8 see page 3), but very little information
is available that examines differences between these groups based
on types of machines and equipment used in their manufacture.
The motive behind characterizing these groups based on types of machines
and equipment used in their production is twofold. First, identification
of specific machine centers can aid in developing secondary wood products
industry training programs, and second, this information can provide
a guide to the equipment necessary for companies that wish to diversify
beyond existing product lines. Adding new machines can help diversify
company operations horizontally, or just enable them to grow in size.
There are many examples in the trade literature of companies that
managed to survive through difficult economic times or became successful
through product diversification (see References on page 4). For example,
a small custom commercial casework shop gained the edge over its competitors
by diversifying into specialty millwork and became a popular choice
among local contractors (6). In this case simply adding a new moulder
allowed the shop to produce millwork. In another example, a successful
furniture manufacturer identified an opportunity in the case goods
market and expanded its operations by purchasing new moulders and
double end tennoners (3). This move also resulted in fuller utilization
of existing machinery and raw materials inventory. Two final examples
include a furniture turnings manufacturer and a kitchen cabinet manufacturer.
The turnings manufacturer diversified into making stair parts by adding
a CNC router, an automatic lathe and a high- frequency glue dryer
(1 - see page 3). The high-end custom kitchen cabinet manufacturer
could not cost effectively produce small batches of quality solid
wood doors. To remedy this situation, he purchased a moulder and now
manufactures doors not only for himself, but also for others, including
his competitors (4).
Objectives
This study has two objectives. The first is to determine the types
of machines used by the value-added industry sector. The second is
to identify commonalties of types of machines used between industry
segments and sales groups.
Methodology
The data came from a comprehensive study of the Louisiana secondary
wood products industry conducted by the Louisiana Cooperative Extension
Service and the Louisiana Forest Products Laboratory (8 - page 3).
Mail questionnaires were sent to 713 companies, the resulting response
rate was 26 percent (187 companies).
The secondary woodworking industry sector was first grouped into
individual industry segments. Then, the differences in types of machines
and equipment used between different segments were analyzed. Because
types of machines and equipment used can vary not only between different
industry segments, but also within a segment between companies of
different sizes, the companies were ranked based on their sales volume
and divided into four sales groups based on these volume rankings.
Differences between these groups within each industry segment were
also analyzed.
For the purpose of this analysis, if a product was produced by more
than 10 companies, it was considered a separate value-added wood industry
segment. Companies in each industry segment were grouped into four
groups based on their 1994 annual sales volume: over $5 million; $5
to $1 million; $150 thousand to $1 million and; under $150 thousand.
Next, for each industry segment and for each sales group within segments,
the percentage of companies using a given type of machine was calculated.
These usage percentages were averaged across all company sizes for
given industry segment, ranked, and plotted in descending order by
percentage. Analysis of machine type usage by various industry segments
by company size was then conducted at the 0.05 significance level.
Comparisons were made to discern differences in machine type usage
between companies of different sizes for each industry segment. Comparisons
of machine type usage for all company sizes across industry segments
were also made.
Results
Respondent companies produced a total of 43 different products. Five
separate value-added industry segments were identified (ranked by
number of companies producing a given product as their primary or
secondary product, namely, kitchen cabinets (61), millwork (30), household
furniture (16), bathroom cabinets (12) and pallets (11). The next
five highest-ranking industry segments not included in this analysis
were replica furniture (7), signs (6), doors (6), custom furniture
(5) and wood office furniture (4).
There were no significant differences in types of machines used for
companies of different sizes within industry segments kitchen cabinets
(Figure 1), household furniture (Figure 3), and bath cabinets (Figure
4). In the millwork segment (Figure 2), large companies significantly
differed from the three other company size categories in terms of
types of machines used. The accompanying figure shows that the difference
exists in specialized equipment that smaller companies typically cannot
afford. There is no significant difference between the three smaller
company size categories.
The pallet industry segment (Figure 5) did not have any companies
in the largest company size category. A significant difference was
found between the second and third largest company size categories.
Comparison of average percentage of machines used by type for all
company size categories across all industry segments confirms previous
results. The only significant difference in type of machines used
is between the pallet and all other industry segments. Non-pallet
industry segments are not significantly different in types of machines
used.
A list of the top 30 most commonly used machines (Figure 6) was also
compiled. This list ranks the machines by the total number of each
machine used by survey respondents.
Implications
There are two main implications that can be derived from identifying
the most frequently used types of machines in and between industry
segments. The first is in the area of developing secondary industry
training and development programs. Specific machine center training
can be aligned to targeted markets and products. Second, companies
considering horizontal diversification can determine the degree of
machine center commonality between industry and product segments.
References
- Billions, D. 1995. High-end solution: Furniture parts manufacturer
grows through diversification. Millwork Manufacturing. Feb. 1995,
pp. 18-20.
- Christoforo, J.C., Bush, R.J. and W.G. Luppold. 1994. A profile
of the U.S. pallet and container industry. Forest Prod. J.
44(2):9-14.
- Cohen, S. 1995. Flexibility works for Trendwood. Furniture Design
& Manufacturing. July 1995, pp. 44-52.
- Ehle, S. 1996. New niche nets new opportunities: Montana custom
cabinet shop diversifies to reduce costs and enhance quality. Wood
Digest. July 1996, pp. 30-33.
- Forbes, L.C., Sinclair, S.A. and W.G. Luppold. 1993. Wood material
use in the U.S. furniture industry: 1990 to 1992. Forest Prod.
J. 43(7/8):59-65.
- Hyland, J. 1995. Millwork completes the package. Furniture Design
& Manufacturing. September 1995, pp. 42-50.
- Vlosky, R.P. 1995. “The kitchen cabinet industry in the U.S. South.”
Working paper. Louisiana Forest Products Laboratory, Baton Rouge,
LA, 18 p.
- Vlosky, R.P., Chance, P.N. and O.V. Harding. 1994. “An overview
of the Louisiana secondary wood products industry.” Working paper.
Louisiana Forest Products Laboratory, Baton Rouge, LA, 31 p.
Authors
Rado Gazo is an Assistant Professor, Purdue University, West
Lafayette, IN 47907-1200.
Richard P. Vlosky is an Associate Professor, Louisiana Forest
Products Laboratory, Louisiana State University Agricultural Center,
Room 227 Forestry, Wildlife and Fisheries Building, Baton Rouge, LA.
70803.
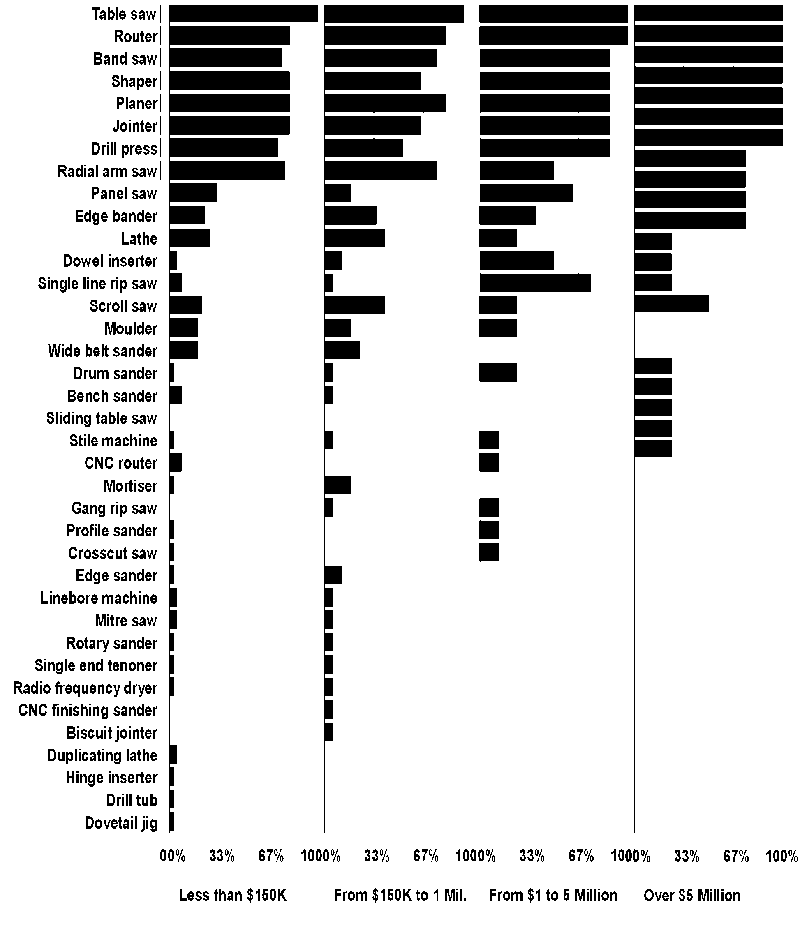
Figure 1. Average machine usage percentage in kitchen cabinet industry
by machine type, by company size.
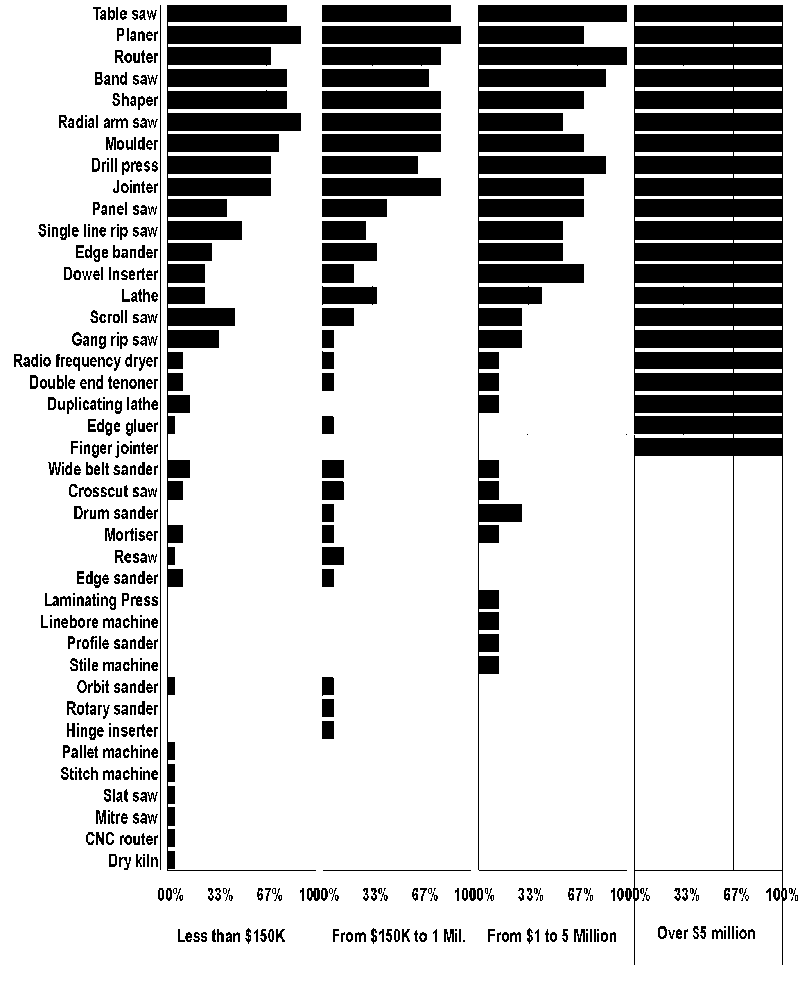
Figure 2. Average machine usage percentage in millwork industry
by machine type, by company size.
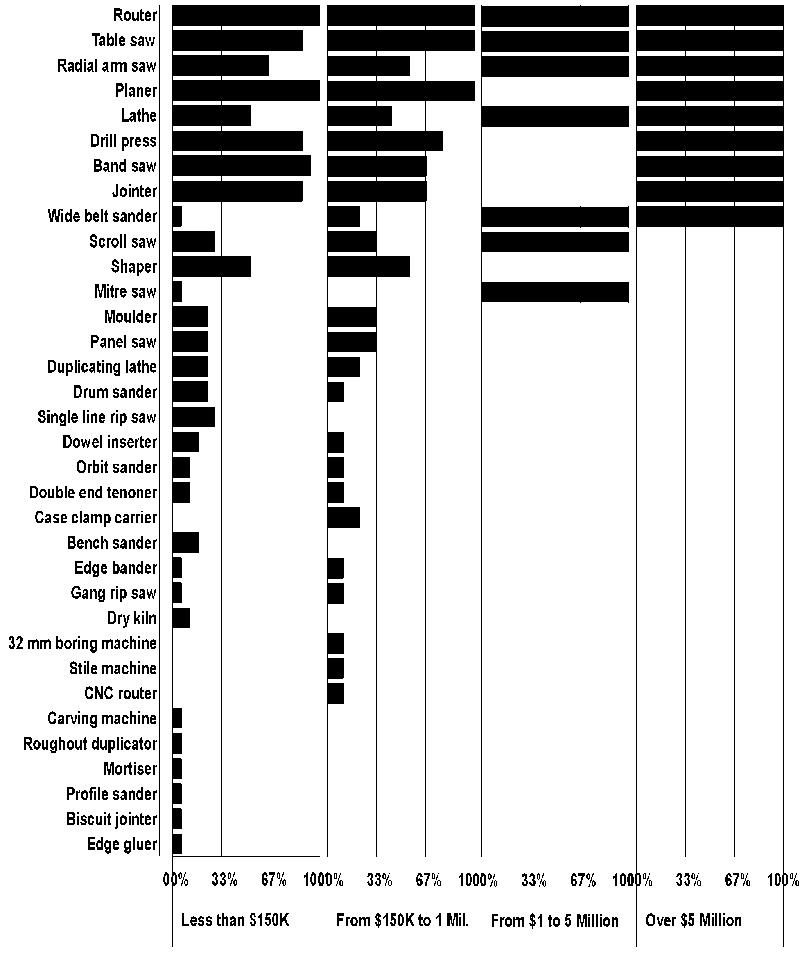
Figure 3. Average machine usage percentage in household furniture
industry by machien type, by company size.
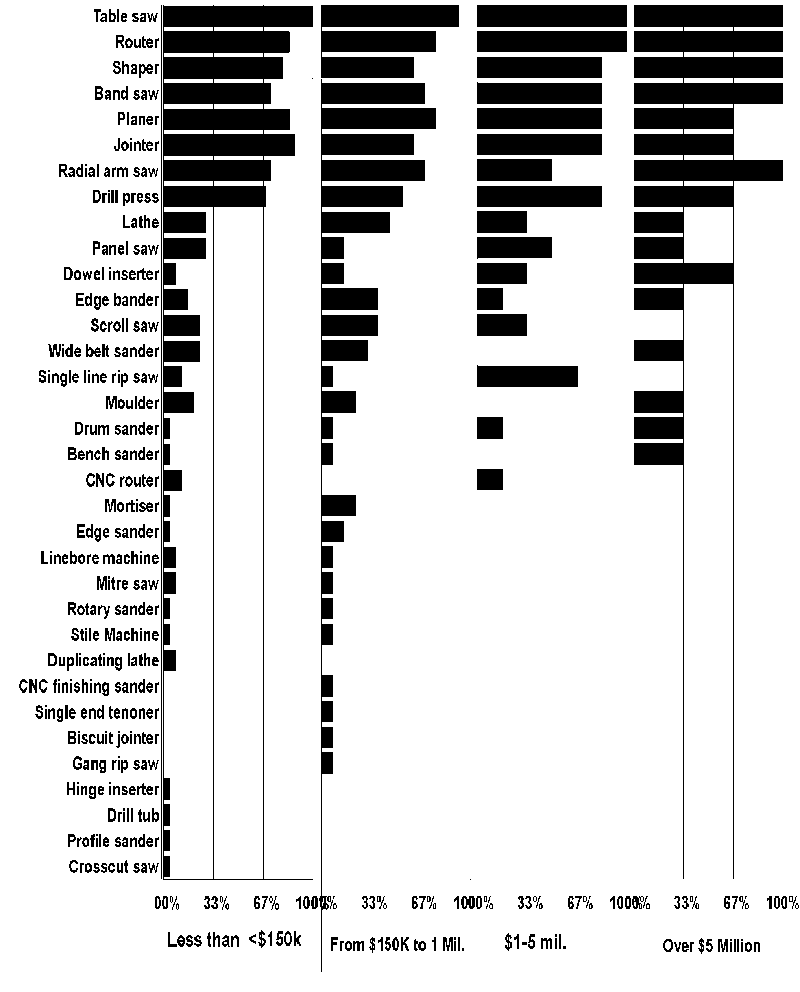
Figure 4. Average machine usage percentage in bathroom cabinet industry
by machine type, by company size.
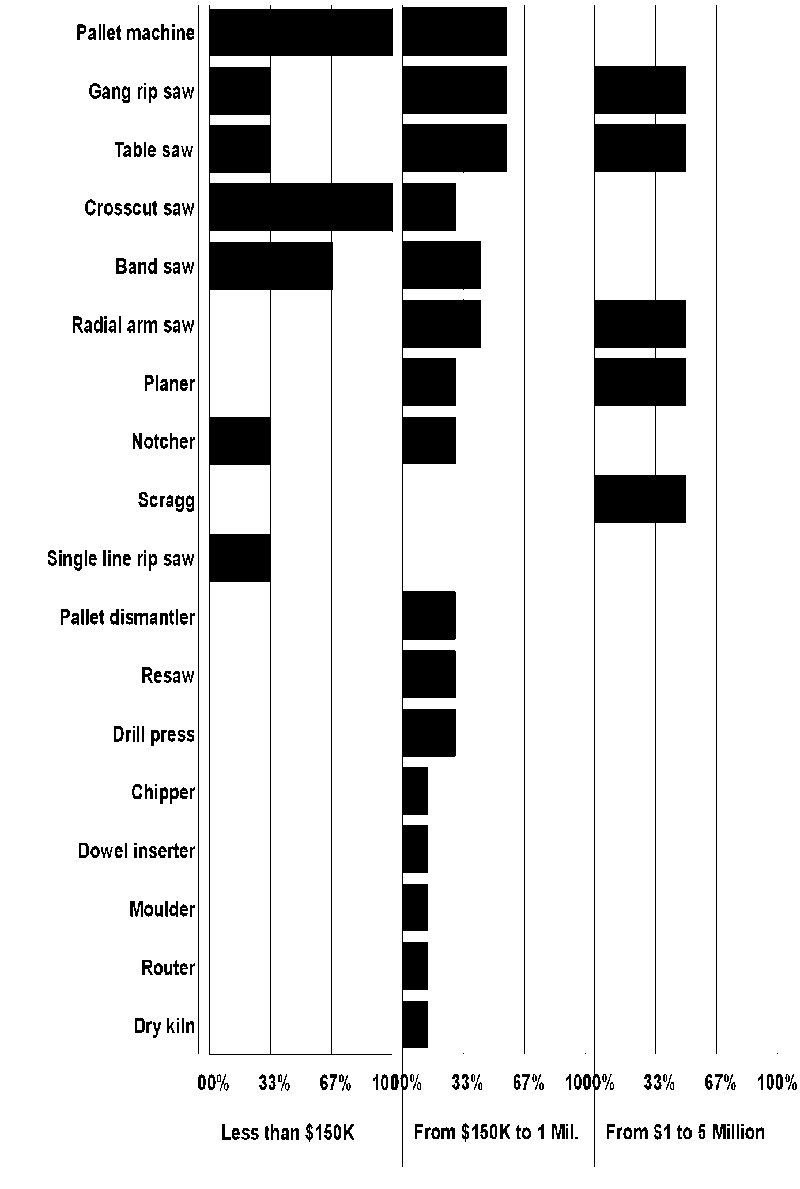
Figure 5. Average machine usage percentage in pallet industry by
machine type, by company size.
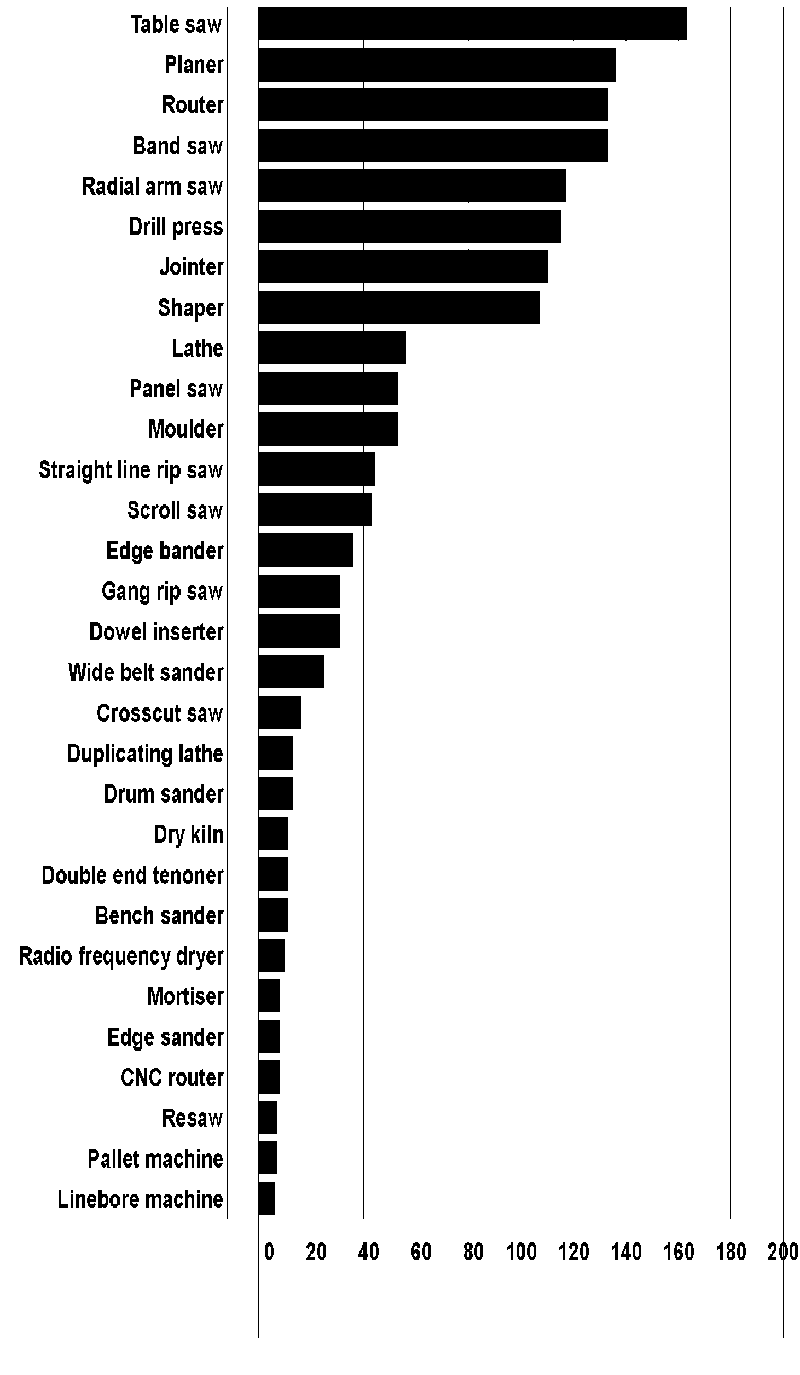
Figure 6. Thirty most commonly used machines.
It is the policy of the Purdue University Cooperative
Extension Service, David C. Petritz, Director, that all persons shall
have equal opportunity and access to its programs and facilities without
regard to race, color, sex, religion, national origin, age, or disability.
Purdue University is an Affirmative Action employer.
This material may be available in alternative formats.
1-888-EXT-INFO
http://www.extension.purdue.edu/extmedia/menu.htm
8/2000
|

