
Evaluation of long-term investments in black walnut plantations. depends on tree growth rates, log quality, and costs incurred, as well as the expected price for logs when the trees are big enough to sell. This publication reviews price changes over the last 40 years and discusses two basic ways to predict future prices using historical price trends. Particular attention is paid to the folly of predicting prices based on a portion of a cycle in prices and of using compound rates of increase to project prices with the effects of inflation removed.
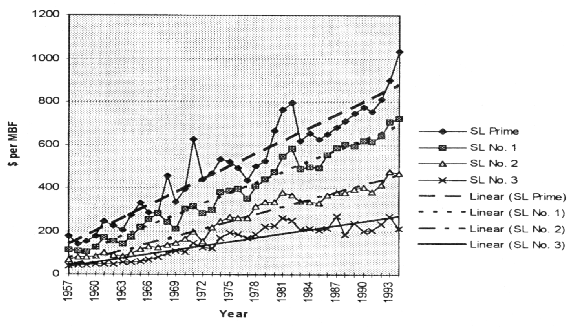
Walnut price data collected for Indiana show that the dramatic price increases of the 1970's and early 80's have yielded to a period of decline followed by renewed increases at a much lower rate. The sawmills and veneer mills processing black walnut apparently realized that the dramatic higher prices paid in the 1970's and early 1980's couldn't be passed on to buyers of lumber and veneer. In addition, the supply of black walnut timber was so scarce that higher prices could do little to make more timber available for harvest.
Based on these observations, it's suggested that the most appropriate way to predict future walnut prices is to use a long-term average trend- line price. The approach is recommended for estimating the financial returns from investments in plantations, not for timber marketing decisions. Marketing decisions should take into account current market conditions. Most owners of timber have the option of waiting out a decline in price levels.
The market for walnut logs in Indiana is highly developed and based on over a century of fine hardwood processing. Logs are shipped to Indiana mills from many other states. Thus, the Indiana price data reflect regional market conditions. However, the amount actually paid to landowners for stumpage varies greatly across the region. Thus. you should seek information from consulting foresters and others familiar with your local market conditions to determine the relationship between the reported prices and prices in your area.
These changes were apparently due to log supply conditions and not increased demand for lumber. Walnut lumber prices change very little (Table 2). The amount of change in a specific size and grade of log is also due in part to sampling error.
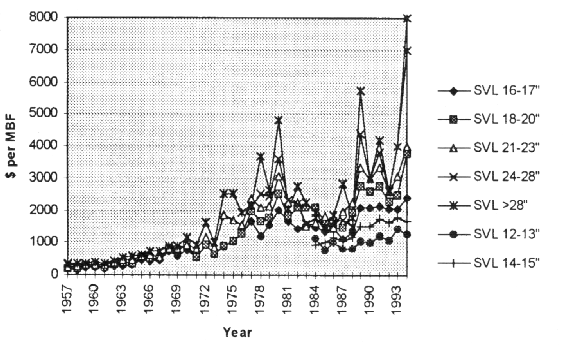
Veneer log prices generally declined from the spring of 1993 to 1994 (Table 3). The only exception was for larger lower grade (select) logs. Improvements in processing technology, especially veneer drying, have increased the value of these logs. The upper grade logs (prime) were down from 4 to 16 percent. The larger select logs were up 17 percent to over 50 percent. Smaller select logs were down 6 to 9 percent.
                   No. Respon.     Mean (s.e)1     Median         Change (%)
 Grade   Range     1993   1994   1993   1994     1993    1994   Mean   Median
----------------------------------------------------------------------------------
 Prime   150-2500   30     20     900   1035     900     1000   15.0   11.1
                                        (40.4)  (103.4)
 No. 1   100-1000   33     24     708    725     700      725   2.4    3.6
                                        (28.9)   (37.7)
 No. 2   200-800    32     25     478    470     500      500   -1.7   0.0
                                        (24.7)   (33.0)
 No. 3   150-350    28     15     270    215     250      200   -20.4  -20.0
                                        (18.2)   (14.1)
1 Standard error of the mean is given in parentheses below the mean.
           Lumber    Jul'91  Jan'92  Jul'92  Jan'93  Jul'93  Jan'94  Jul'94
           Grade
---------------------------------------------------------------------------------
Black Walnut
            FAS       1605    1605    1605     1605    1605    1615    1615
           No. 1C      855     855     855      855     855     855     855
           No. 2A      290     290     290      290     290     290     290
                           No. Respon.   Mean (s.e.)1       Median         Change (%)
Species/Grade/  '94
Leg Dia.       Range       '93   '94    '93    '94        '93    '94     Mean   Median
---------------------------------------------------------------------------------------
Prime                                     ($/MBF)           ($/MBF)
---------------------------------------------------------------------------------------
12-13       1000-2500       6     7      1850    1786     1750   2000    -3.5    14.3
                                        (269.3)  (184.4)
14-15       2000-3000       7     8      2543    2438     2500   2250    -4.1   -10.0
                                        (385.4)  (175.2)
16-17       2500-5000       6     8      3742    3500     3875   3000    -6.5   -22.9
                                        (552.3)  (313.4)
18-20       3000-6000       6     6      4625    4500     4375   4250    -2.7   -2.9
                                        (768.5)  (447.2)
21-23       4000-5500       4     3      5375    4833     5000   5000    -10.1   0.0
                                        (1028.2) (441.0)
24-28       4000-8000       2     3      7000    5833     7000   5500    -16.7  -21.4
                                        (1000.0) (1166.7)
>28         4000-10000      1     3      6000    6500     6000   5500     8.3   -8.3
                                                 (1802.8)
Select
12-13       800-1500        4     5      1425    1300     1500   1500    -8.8    0.0
                                        (75.0)   (137.8)
14-15       1000-2000       6     6      1767    1667     1750   1750    -5.7    0.0
                                        (197.8)  (166.7)
16-17       1500-4000       5     6      2060    2417     1700   2000     17.3   17.7
                                        (294.3)  (374.5)
18-20       3000-6000       5     4      2480    3750     2000   3000     51.2   50.0
                                        (453.2)  (750.0)
21-23       4000            4     1      3050    4000     3100   4000     31.2   29.0
                                        (550.0)
24-28       7000            1     1      4000    7000     4000   7000     75.0   75.0

>28         8000            0     1      ---	 8000      --    8000     --      --
---------------------------------------------------------------------------------------
1 Standard error of the mean is given in parentheses below the mean
The price increases observed for walnut in the late 1970's and early 1980's with the affect of inflation removed, i.e. real prices, couldn't continue. To illustrate, consider the relative value of a board foot of walnut and a new car 40 years from now. Say the walnut is veneer quality timber now worth $5.00 a foot and the car is worth $20,000. both in terms of what a dollar will buy in 1994. The car is equivalent in value to 4,000 board feet (MBF) of walnut veneer logs. Now assume that walnut prices increase 8 percent per year in terms of 1994 dollars for 40 years and the price of the car stays the same. The walnut price goes to $109 per board foot. The car is then equivalent in value to 184 board feet of walnut. In general, however the relative values for the mix of goods and services consumers desire don't change that dramatically. By the way, car prices have increased primarily because of inflation and additional features, not because the real cost of basic labor and material inputs have increased.
Let's next consider walnut price trends and discuss whether or not they are sustainable at current levels.
                      Veneer Leg Grade
  Leg Size          Prime          Select
------------------------------------------
     12-13          2.246          1.522
     14-15          3.910          1.169
     16-17          1.833          1.783
     18-20          2.039          2.283
     21-24          2.268          1.975
     25-28          2.023          1.871
       >28          2.246          2.379
            Sawlogs                  Prime Veneer Logs            Select Sawlogs
Grade      Slope    Intercept   Size    Slope   Intercept   Size   Slope     Intercept
                                (in.)                       (in.)
--------------------------------------------------------------------------------------
SLPrime   -1.64872   800.3871   16-17  41.21946  1493.375   16-17  25.73094  969.1857
SL No.1    1.37384   532.6862   18-20  56.16011  1745.933   18-20  38.42414  1008.315
SL No.2    2.28446   312.1157   21-24  70.14297  1860.165   21-24  40.19652  1308.754
SL No.3    0.977718  203.7385   24-28  74.64466  2344.795   24-28  44.79385  1575.474
                                >28    86.23988  2319.89    >28    60.54943  1491.143
                                12-13  23.36613  1177.36    12-13  15.21029  826.2637
                                14-15  23.36424  1666.254   14-15  51.81863  881.0242
--------------------------------------------------------------------------------------
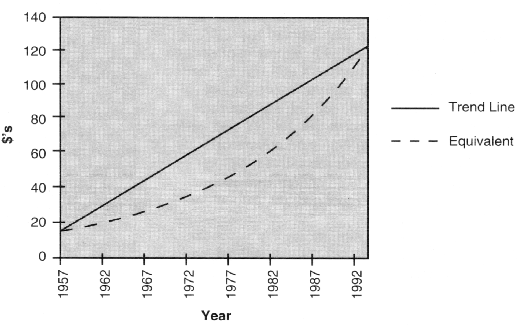
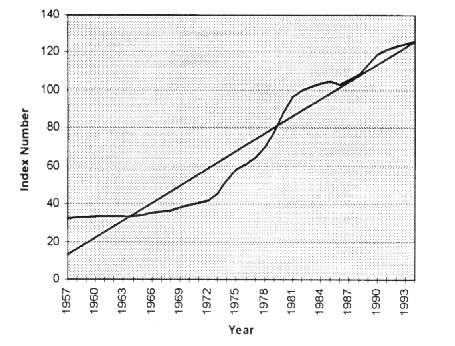
Investments should be judged in terms of the actual increase in purchasing power of the money invested. Therefore, we need to look at the price increase in terms of constant (real) dollars. The producer price index for finished goods is used as the indicator of inflation (Figure 3). Consumer prices follow the same pattern as producer prices over the long run. The trend line for inflation is equivalent to a 6.3 percent compound interest rate. To protect the purchasing power of the amount invested. the timber should increase in unit price at least at this rate. It's the total real rate of return, however, that should ultimately be used to decide on whether or not to make the investment.
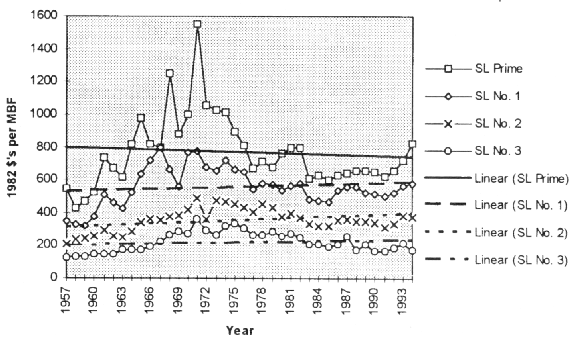
The degree to which the increase in price has kept up with inflation is judged by "deflating" log prices. This is done by dividing the actual price by the producer price index. The resulting "real price" series can be used to evaluate the real price increase.
The real price of prime sawlogs increased dramatically, although in cycles, from 1957 to 1971 (Figure 4). After 1971 the real prices for prime sawlogs have not kept up with inflation. The trend line reflects a 0.2 percent decline. The real price of the lower grade logs has just barely kept up with inflation. The real increases for the 1957 to 1994 period were 0.2. 0.6, and 0.4 percent for No. 1, No. 2. and No. 3 sawlogs respectively.
 Year   Prime    No.1   No.2     No.3     PP
----------------------------------------------
 1957    176     114     67       41     32.5
 1958    142     108     80       45     33.2
 1959    155     106     82       45     33.1
 1960    176     127     86       49     33.4
 1961    245     170     99       50     33.4
 1962    225     155     87       50     33.5
 1963    205     142     85       58     33.4
 1964    273     175     95       58     33.5
 1965    333     218    116       60     34.1
 1966    288     254    128       68     35.2
 1967    284     283    126       80     35.6
 1968    457     243    138       98     36.6
 1969    335     212    145      109     38.0
 1970    394     303    165      107     39.3
 1971    627     314    199      147     40.5
 1972    440     282    153      124     41.8
 1973    467     300    217      121     45.6
 1974    532     379    248      169     52.6
 1975    521     387    265      195     58.2
 1976    491     394    262      185     60.8
 1977    436     352    263      171     64.7
 1978    499     407    315      185     69.8
 1979    525     442    335      222     77.6
 1980    668     473    334      226     88.0
 1981    764     544    381      264     96.1
 1982    796     581    368      249    100.0
 1983    620     490    339      210    101.6
 1984    655     495    336      214    103.7
 1985    627     493    333      206    104.7
 1986    652     554    369      214    103.2
 1987    681     586    381      271    105.4
 1988    712     601    379      186    108.0
 1989    749     594    397      239    113.6
 1990    777     619    406      201    119.2
 1991    754     613    383      207    121.7
 1992    813     643    416      235    123.2
 1993    900     708    478      270    124.7
 1994   1035     725    470      215    125.5
----------------------------------------------
                      Prime Veneer Logs                                  Select Veneer Logs
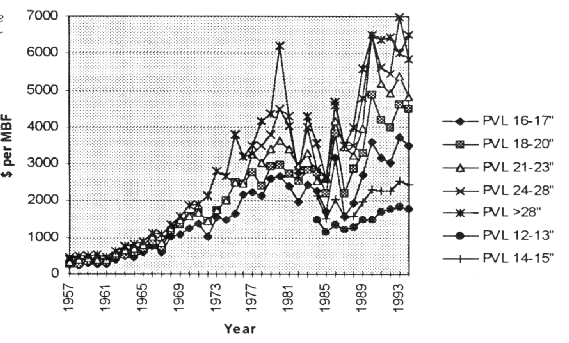
Year  12-13" 14-15" 16-17" 18-20" 21-23" 24-28" >28" 12-13" 14-15" 16-17" 18-20" 21-23" 24-28"  >28"
----------------------------------------------------------------------------------------------------
1957                 261    261     333   400   475                  178    178    241    293   334
1958                 215    280     398   480   480                  165    190    275    360   360
1959                 285    350     443   500   500                  243    285    323    363   363
1960                 280    328     412   540   540                  215    260    320    405   405
1961                 260    318     410   463   463                  213    245    298    353   353
1962                 408    500     545   635   635                  273    318    373    428   428
1963                 495    540     655   760   760                  290    370    455    550   550
1964                 460    580     700   840   840                  298    345    450    575   575
1965                 608    697     790   885   885                  449    558    600    634   634
1966                 755    894    1027  1115  1115                  438    492    619    737   737
1967                 604    733     858  1077  1077                  460    508    560    740   740
1968                1009   1195    1244  1340  1340                  734    808    834    910   910
1969                1083   1360    1500  1594  1594                  575    758    812    883   883
1970                1250   1578    1578  1875  1875                  781    936    936   1170  1170
1971                1381   1687    1687  1907  1907                  550    550    818    944   944
1972                1035   1467    1467  2150  2150                  929    929   1182   1633  1633
1973                1557   1750    1750  2800  2800                  660    660    850  i1021  1021
1974                1498   2005    2005  2659  2659                  874    874   1850   2517  2517
1975                1659   2493    2493  3793  3793                 1043   1043   1719   2505  2505
1976                2193   2483    2483  3188  3188                 1286  11286   1556   1930  1930
1977                2242   2766    3280  3280  3500                 1683   2000   2375   2150  2175
1978                2140   2400    3027  3500  4157                 1190   1675   2105   2525  3675
1979                2608   2941    3412  3808  4350                 1542   1785   2150   2428  2642
1980                2661   2966    3634  4500  6214                 2024   2509   3061   3606  4800
1981                2404   2725    3394  4015  4298                 1666   1843   2246   2317  2075
1982                1966   2540    2933  2825  2666                 1450   2100   2250   2233  2750
1983                2440   2850    3300  4000  4300                 1550   2100   1500   1600  2250
1984  1470   2133   2270   2775    2533  2866  3550   1120    925   1475   2087   1650   1800  1950
1985  1150   1533   1708   2228    2614  2666  2625    775   1000   1371   1625   1825   1433  1500
1986  1340   2060   3180   3820    4160  4575  4700   1000   1150   1420   1440   1480   1675  1875
1987  1220   1560   1600   2200    3466  3500  3500    800   1050   1125   1466   1966   1700  2850
1988  1300   1590   1940   2880    3250  3500  4000    800   1163   1325   1925   2267   1500  1800
1989  1482   1993   2695   3305    3965  4792  5594   1030   1496   2088   2764   3343   4383  5750
1990  1480   2300   3600   4875    6500  6500  6500   1025   1500   2100   2600   3000   3000  3000
1991  1728   2281   3177   4182    5188  5625  6375   1200   1757   2143   2750   3333   3800  4200
1992  1780   2293   3054   3996    4907  5443  6429   1075   1617   2050   2286   2600   2600  2625
1993  1850   2543   3742   4625    5375  7000  6000   1425   1767   2060   2480   3050   4000  4000
1994  1786   2438   3500   4500    4833  5833  6500   1300   1667   2417   3750   4000   7000  8000
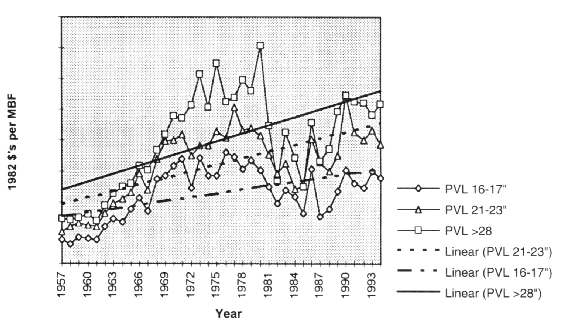
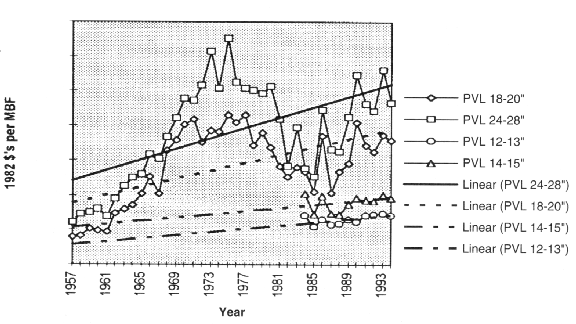
The deflated (real) prices and trend lines for the seven size classes of prime and select veneer logs are shown in Figures 7 to 10. The long-term trend lines show a pattern similar to sawlogs. The trend lines don't, however, reflect prices during the 1970's and overestimate price levels in the 1957 to late 1960's, and again from the late 1980's to the early 1990's. High prices in the 1970's "pulled up" the trend line, placing it well below the exceptionally high prices of the 1970's. The unsustainably high prices of the 1970's caused projections based on the 1957 to the early 1980's data to yield grossly exaggerated estimates of increases.
Applying the concept of an average compound rate of increase for the trend lines for veneer logs, as discussed for sawlogs, gives higher rates of increase than for sawlogs. The trend line increases for veneer logs are given in Table 4. The largest increases are for small, high-quality veneer logs. This is inconsistent with pricing patterns over the last several years. Comparisons between the two smallest classes and the other size classes must be made with caution. Prices for 12 to 15 inch logs weren't collected until 1984. This was several years after markets for small veneer logs were well established.
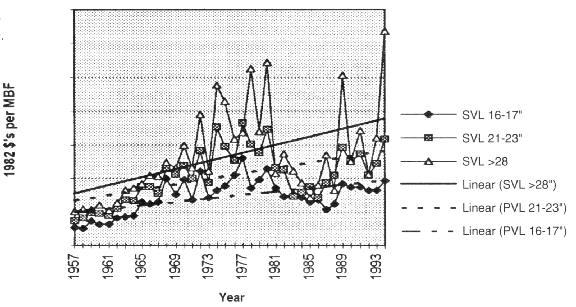
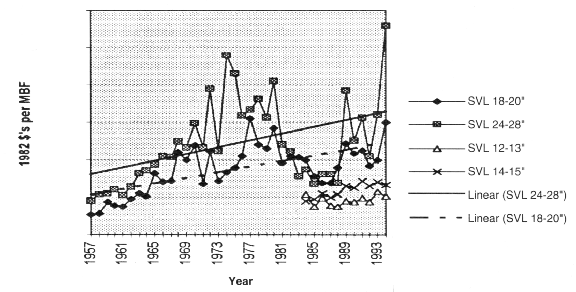
Investors also frequently use current prices to make investment analyses. Since walnut log prices are cyclical, this could give an unreasonably high or low level. An alternative is to use the current price from the trend line. If you believe that prices will continue to increase based on historical patterns, then use the equation for a straight line to project the price. The equation is,
P = a + b T,
where, "a" is the intercept and "b" is the slope. These values are given in Table 5. "T" ranges from 1 to 38 for years 1957 to 1994 for sawlogs and the five largest veneer logs sizes. "T" ranges from 1 to 11 for years 1984 to 1994 for the two smallest veneer log sizes. To project the price of a given type of log, substitute into the equation the value of T for the number of additional years of interest. For example. the 1982 base year trend line price for one thousand board feet (MBF) of 16-17 select veneer logs in the year 2039 (45 year projection), would be,
Price = 969.18 + 25.731 x (83) = $3,105 per MBF
Note that if the exponential method was used the projected price would be,
Price 1947 x (1.01783)^ 4/5 = $4,313 per MBF
In this equation $1,947 is the trend line price in 1994 and 1.01783 is (1 + i), where i is the interest rate from Table 4. The exponent, 45, is the number of years the price is compounded at 1.783 percent per year.